Copyright
©The Author(s) 2015.
World J Gastroenterol. Jun 28, 2015; 21(24): 7577-7583
Published online Jun 28, 2015. doi: 10.3748/wjg.v21.i24.7577
Published online Jun 28, 2015. doi: 10.3748/wjg.v21.i24.7577
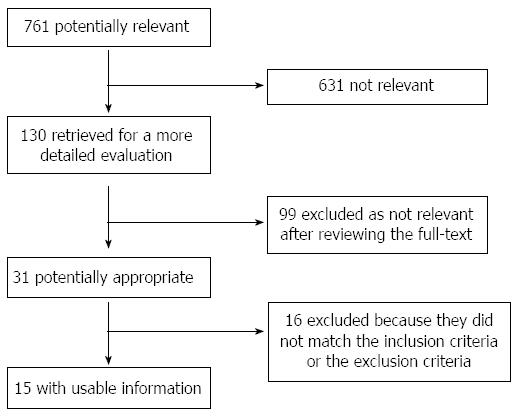
Figure 1 Publication retrieval flow chart.
A flow chart depicting the step-by-step search process with respect to the eligibility criteria and the retrieval of published literature of the randomized controlled trials.
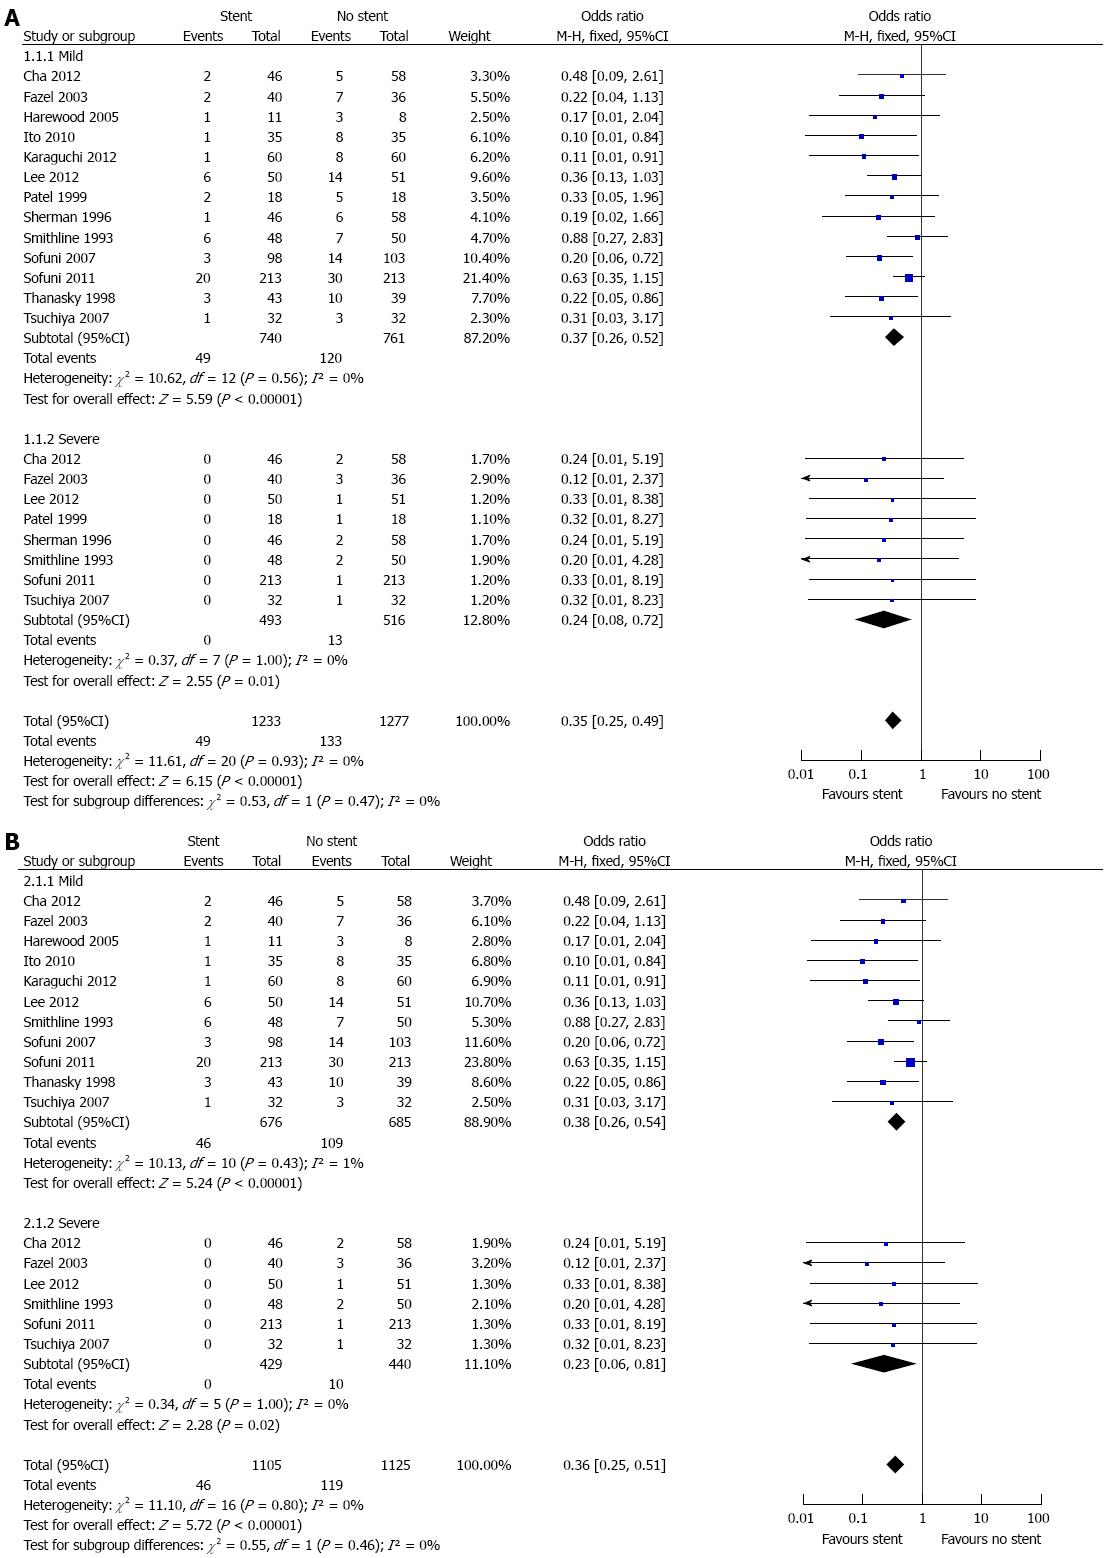
Figure 2 Forest plots.
A: A forest plot depicting the incidence of post-endoscopic retrograde cholangiopancreatography pancreatitis (PEP) in the analyzed studies; data from both articles and abstracts were included; B: A forest plot depicting the incidence of PEP in the analyzed studies; data from the abstracts were excluded.
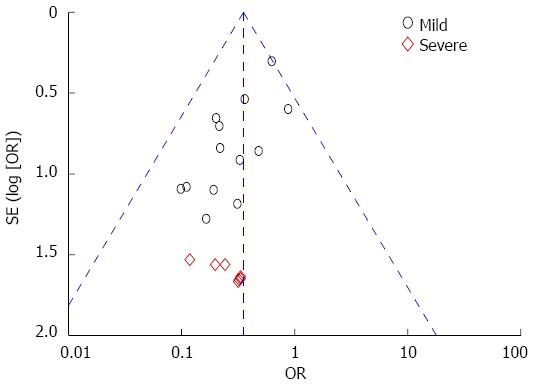
Figure 3 Publication bias funnel plot.
A funnel plot depicting the assessment of publication bias of the eligible studies included in this meta-analysis.
- Citation: Fan JH, Qian JB, Wang YM, Shi RH, Zhao CJ. Updated meta-analysis of pancreatic stent placement in preventing post-endoscopic retrograde cholangiopancreatography pancreatitis. World J Gastroenterol 2015; 21(24): 7577-7583
- URL: https://www.wjgnet.com/1007-9327/full/v21/i24/7577.htm
- DOI: https://dx.doi.org/10.3748/wjg.v21.i24.7577


