Copyright
©The Author(s) 2015.
World J Gastroenterol. Jun 28, 2015; 21(24): 7522-7528
Published online Jun 28, 2015. doi: 10.3748/wjg.v21.i24.7522
Published online Jun 28, 2015. doi: 10.3748/wjg.v21.i24.7522
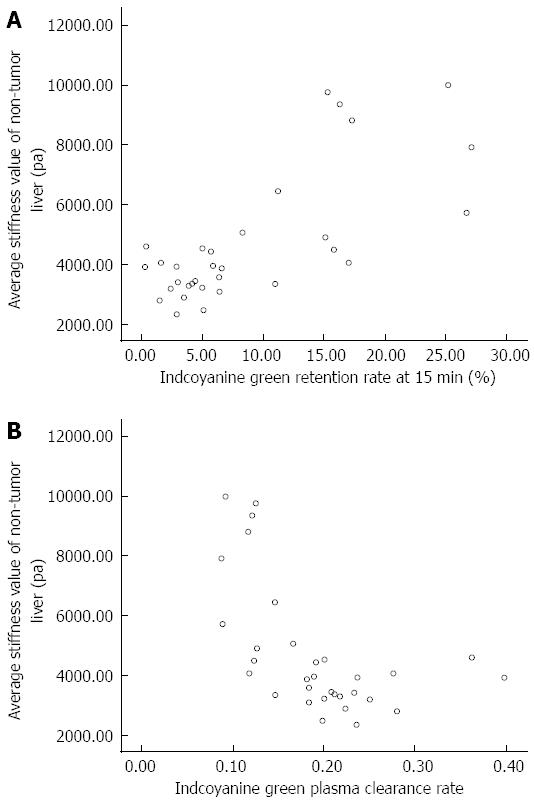
Figure 1 Distribution of the correlations between the non-tumor liver stiffness values and the indocyanine green retention rate at 15 min (A) or the indocyanine green plasma clearance rate (B).
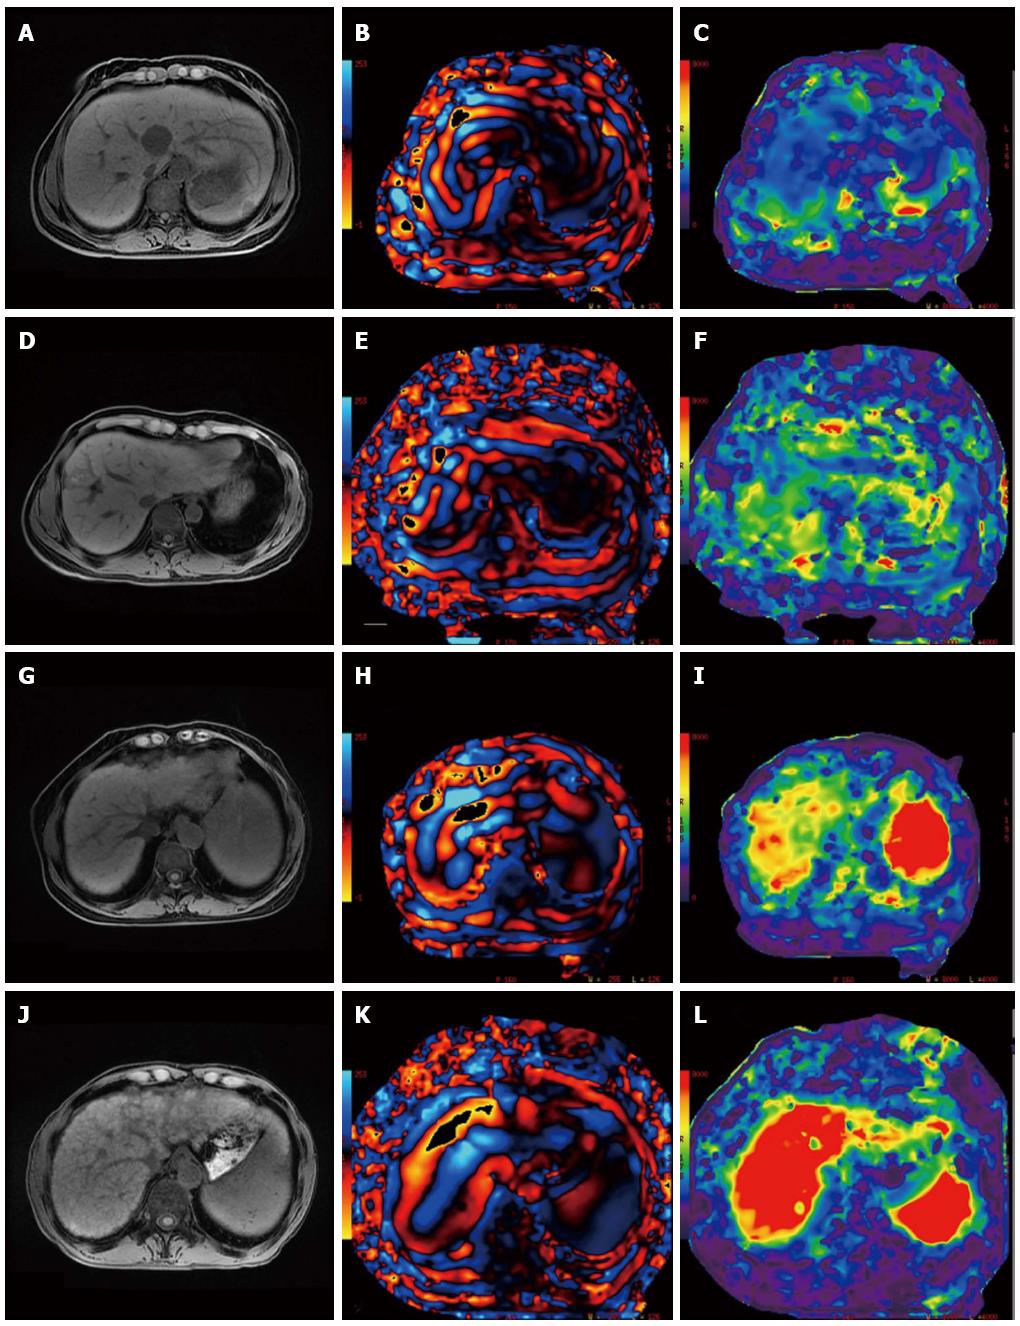
Figure 2 Liver stiffness with different degrees of fibrosis measured using magnetic resonance elastography and its relevant indocyanine green retention rate at 15 min and indocyanine green plasma clearance rate.
A-C: LS, 2.9 kPa; ICGR-15, 0.003; ICG-K, 0.398; D-F: LS, 4.4 kPa; ICGR-15, 0.057; ICG-K, 0.191; G-I: LS, 5.1 kPa; ICGR-15, 0.083; ICG-K, 0.166; J-L: LS, 10 kPa; ICGR-15, 0.252; ICG-K, 0.092. ICGR-15: Indocyanine green retention rate at 15 min; ICG-K: Indocyanine green plasma clearance rate; LS: Liver stiffness.
- Citation: Li B, Min J, Liang WR, Zhang GQ, Wu JJ, Jin K, Huang W, Ying CY, Chao M. Use of magnetic resonance elastography for assessing liver functional reserve: A clinical study. World J Gastroenterol 2015; 21(24): 7522-7528
- URL: https://www.wjgnet.com/1007-9327/full/v21/i24/7522.htm
- DOI: https://dx.doi.org/10.3748/wjg.v21.i24.7522


