Copyright
©The Author(s) 2015.
World J Gastroenterol. Jun 7, 2015; 21(21): 6639-6648
Published online Jun 7, 2015. doi: 10.3748/wjg.v21.i21.6639
Published online Jun 7, 2015. doi: 10.3748/wjg.v21.i21.6639
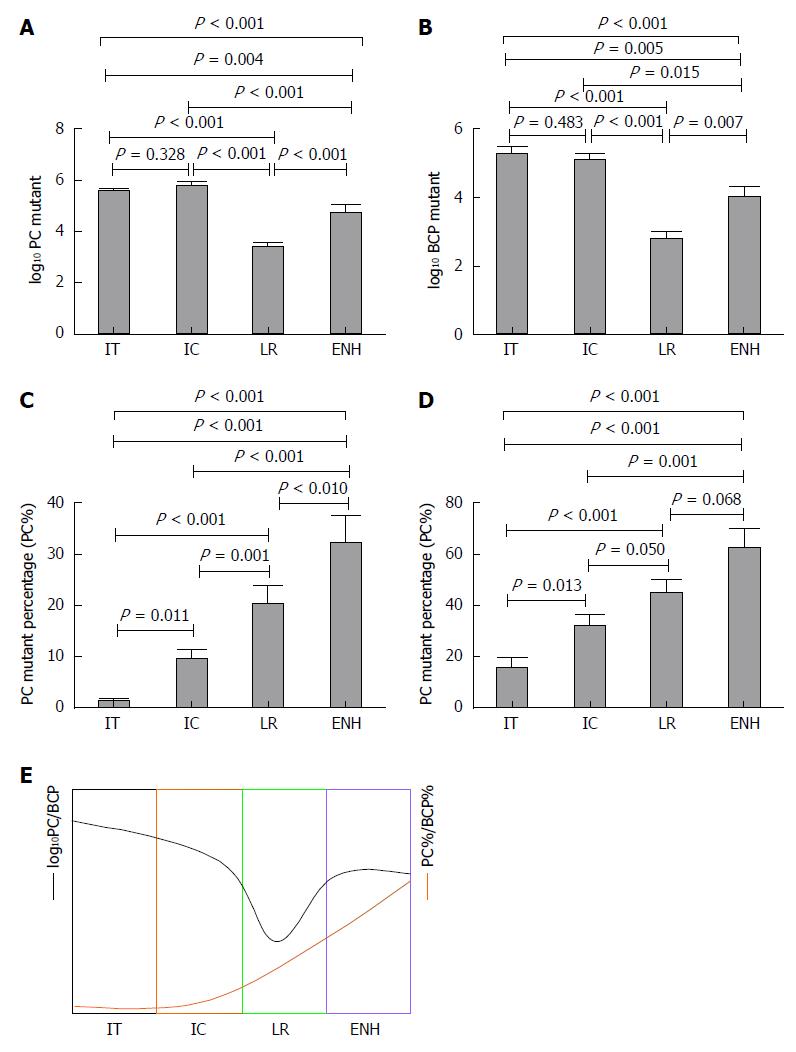
Figure 1 Precore, basal core promoter mutation distribution throughout phases of hepatitis B virus infection.
Log10 precore, log10 basal core promoter value (A, B), precore%, basal core promoter (%) (C, D) distribution through the phases of hepatitis B virus infection; disease progression can be estimated by the combination of log10 precore, log10 basal core promoter and precore%, basal core promoter (%) (E). PC: Precore; BCP: Basal core promoter; IT: Immune tolerance; IC: Immune clearance; LR: Low-replicative; ENH: HBeAg-negative hepatitis; HBeAg: Hepatitis B early antigen; PC%: PC mutant quantity per total viral load; BCP%: BCP mutant quantity per total viral load.
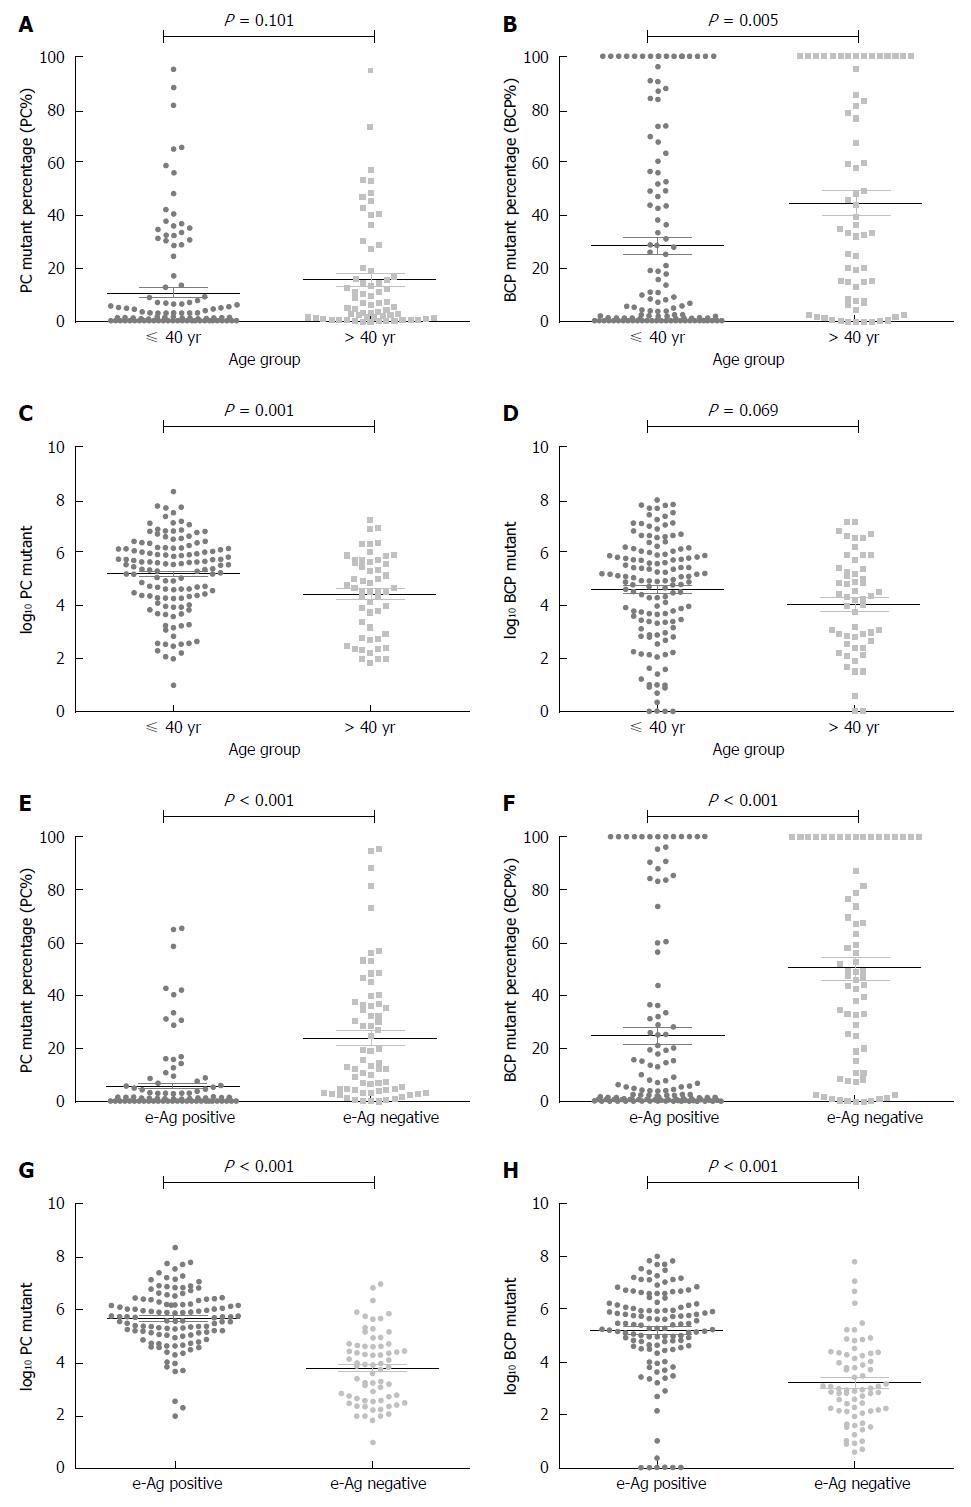
Figure 2 Precore, basal core promoter mutation distribution by patient age subgroup and hepatitis B early antigen status.
Age subgroup vs PC mutation percentage (PC%) (A), and BCP mutation percentage (BCP%) (B); Age subgroup vs log10 PC (C) and log10 BCP (D); HBeAg status vs PC% (E) and BCP% (F); HBeAg status vs log10 PC (G) and log10 BCP (H). Short horizontal lines flanking the means indicate SE. PC: Precore; BCP: Basal core promoter; PC%: PC mutant quantity per total viral load; BCP%: BCP mutant quantity per total viral load; HBV: Hepatitis B virus; ALT: Alanine aminotransferase; HBeAg: Hepatitis B early antigen.
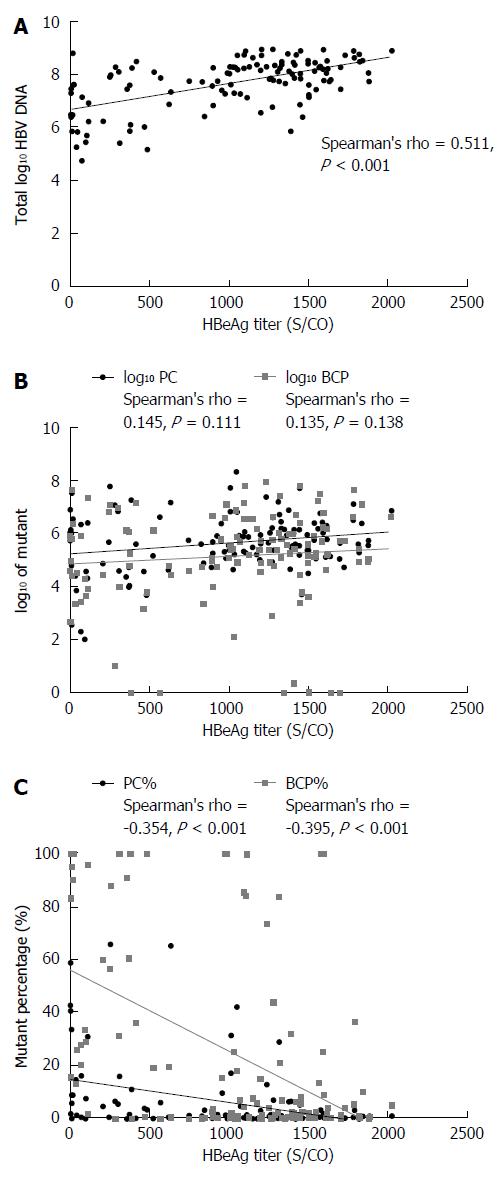
Figure 3 Correlation between hepatitis B early antigen titer and total log10 hepatitis B virus DNA (A); log10 precore, log10 basal core promoter value (B); and precore%, basal core promoter (%) (C).
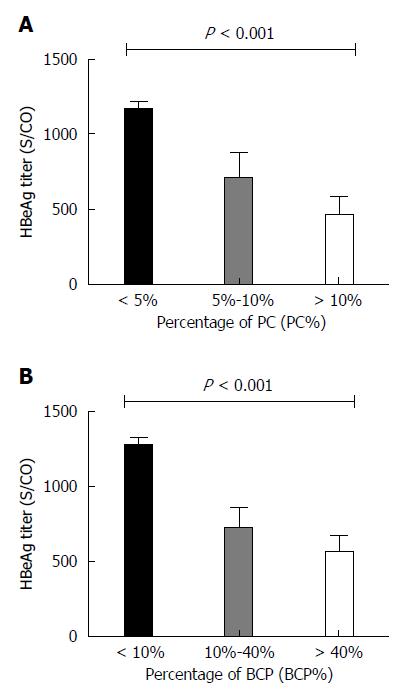
Figure 4 Differential subgroup distributions of precore%, basal core promoter (%) and hepatitis B early antigen titers.
PC: Precore; BCP: Basal core promoter; PC%: PC mutant quantity per total viral load; BCP%: BCP mutant quantity per total viral load.
- Citation: Tu WH, Lv Y, Zhang YM, Hou W, Wang JY, Zhang YJ, Liu HY, Zhu HX, Qin YL, Mao RC, Zhang JM. Precore/basal core promoter mutants quantification throughout phases of hepatitis B virus infection by Simpleprobe. World J Gastroenterol 2015; 21(21): 6639-6648
- URL: https://www.wjgnet.com/1007-9327/full/v21/i21/6639.htm
- DOI: https://dx.doi.org/10.3748/wjg.v21.i21.6639


