Copyright
©The Author(s) 2015.
World J Gastroenterol. Jun 7, 2015; 21(21): 6582-6590
Published online Jun 7, 2015. doi: 10.3748/wjg.v21.i21.6582
Published online Jun 7, 2015. doi: 10.3748/wjg.v21.i21.6582
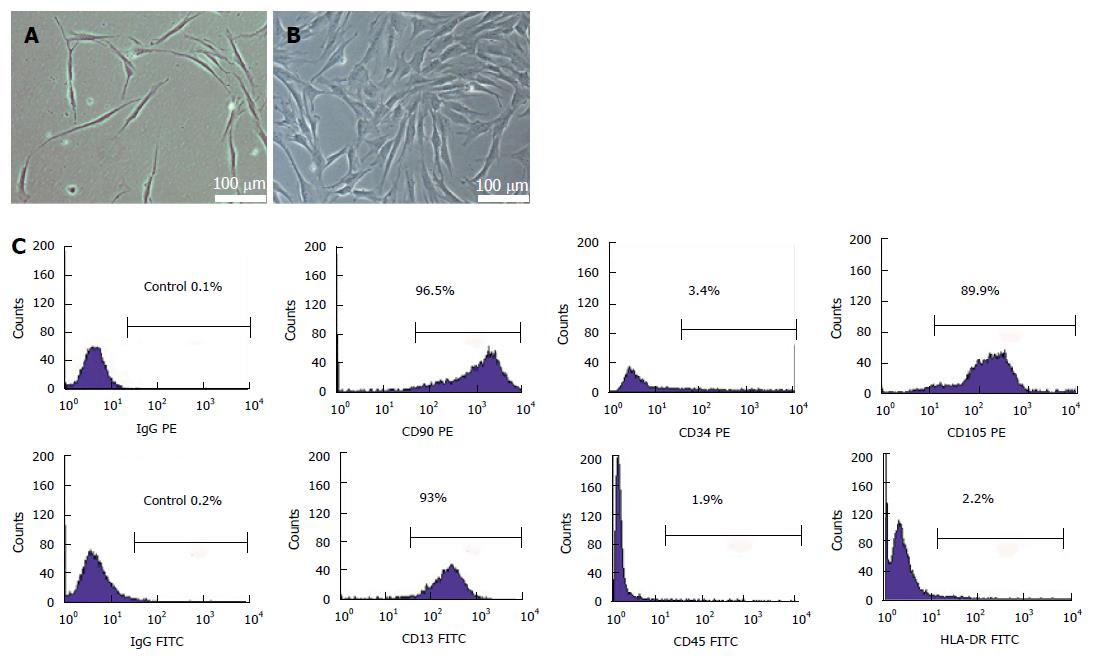
Figure 1 Isolation and identification of umbilical cord mesenchymal stem cells.
Cells displayed spindle-shaped, fibroblast-like morphology (A) and they clonally grew and spread at the bottom of a culture dish within the 12th d (B); Flow cytometric analysis showed that the isolated cells at passage 4 strongly expressed the surface markers of mesenchymal stem cells, such as CD90, CD105 and CD13, but almost no markers of hematopoietic stem cells, such as CD34, CD45 and HLA-DR (C). PE: Phycoerythrin; FITC: Fluorescein isothiocyanate.
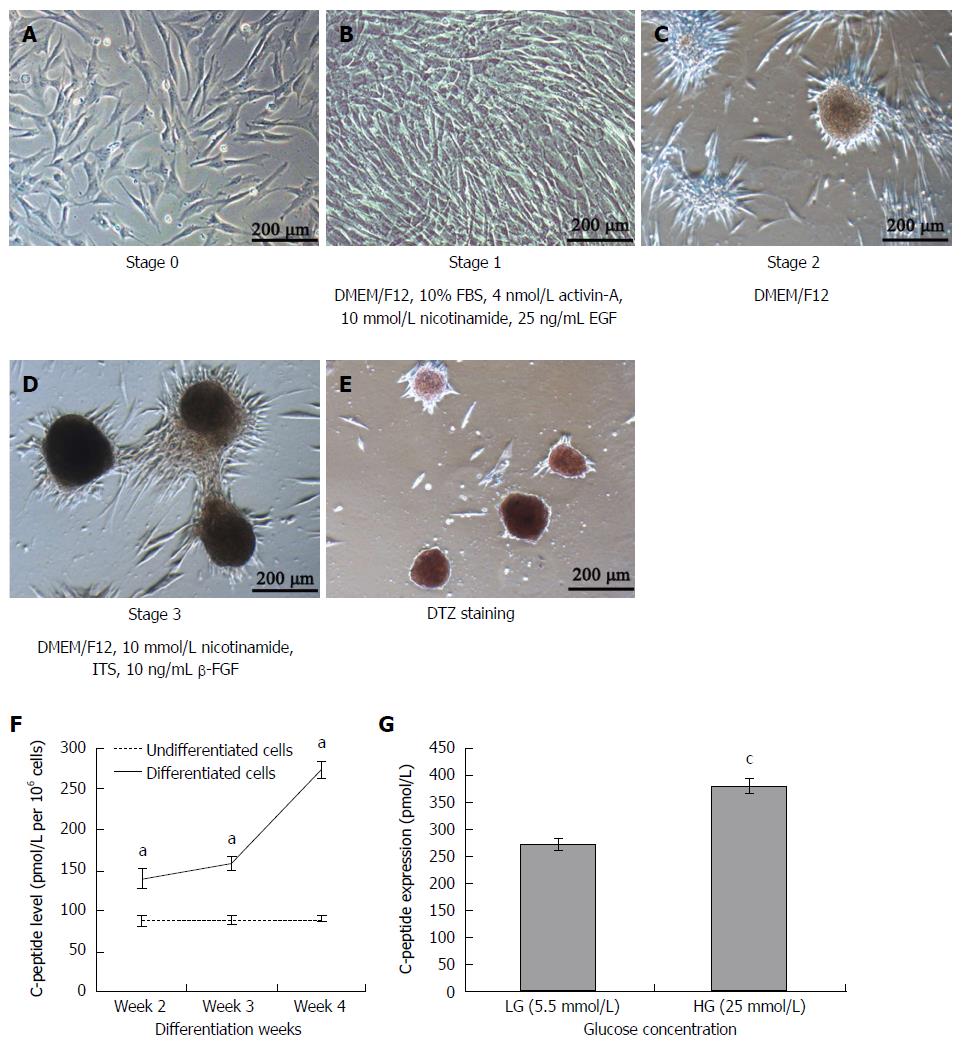
Figure 2 Morphological changes of umbilical cord mesenchymal stem cells during differentiation and C-peptide secretion and stimulation by high glucose levels.
Spindle-shaped and fibroblast-like cells (A, stage 0) were induced to islet-like cluster formation by a 3-stage protocol in 4 wk. After 7 d of induction cells turned round and assembled together (B, stage 1); After another 7 d the round cells became aggregate and some new islet-like clusters began to appear (C, stage 2) and at the end of days 21 mature islet-like clusters with the set of differentiated cells (D, stage 3) that were positive for DTZ staining appeared (E); Spontaneous C-peptide secretion. The media for 106 cells were collected at weeks 2, 3 and 4 and C-peptide concentration were measured (F, aP < 0.05 vs Undifferentiated cells); Glucose challenge test for C-peptide release in response to low (5.5 mmol/L) or high (25 mmol/L) glucose concentration by week 4 differentiated cells (G, cP < 0.05 vs 5.5 mmol/L glucose). Results are the mean ± SE for 6 experiments.
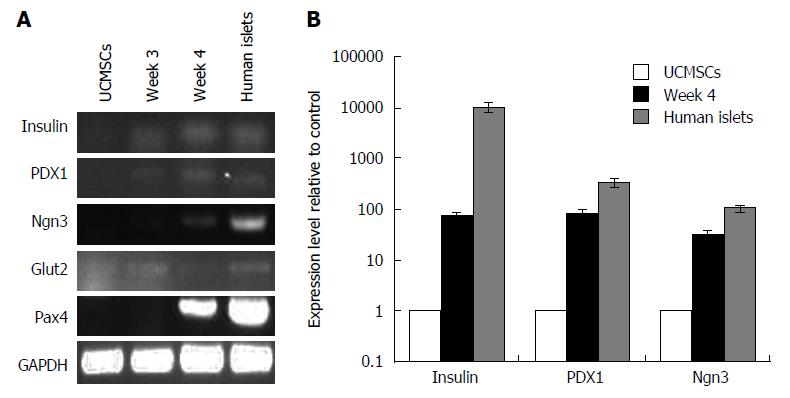
Figure 3 Reverse transcription-polymerase chain reaction and real-time reverse transcription-polymerase chain reaction analysis of the expression of pancreatic β-cell development-related genes and insulin production-related genes.
A: RT-PCR of the undifferentiated UCMSCs and those during the phases of differentiation (weeks 3 and 4). At the end of differentiation (week 4), the gene expression of IPCs was similar to that of human islets; B: Real-time RT-PCR analysis of UCMSCs. After three-step induction, the UCMSCs expressed high levels of the specific regulation genes for neogenesis and development of pancreatic β-cells, including PDX1, Ngn3 and of hallmark genes for mature islet cells, including insulin. Compared to those of human islets, the differentiated cells (week 4) expressed more Ngn3 and Pax4 and insulin (P < 0.05, n = 3). Each gene was tested in triplicate. RT-PCR: Reverse transcription-polymerase chain reaction; UCMSCs: Umbilical cord mesenchymal stem cells.
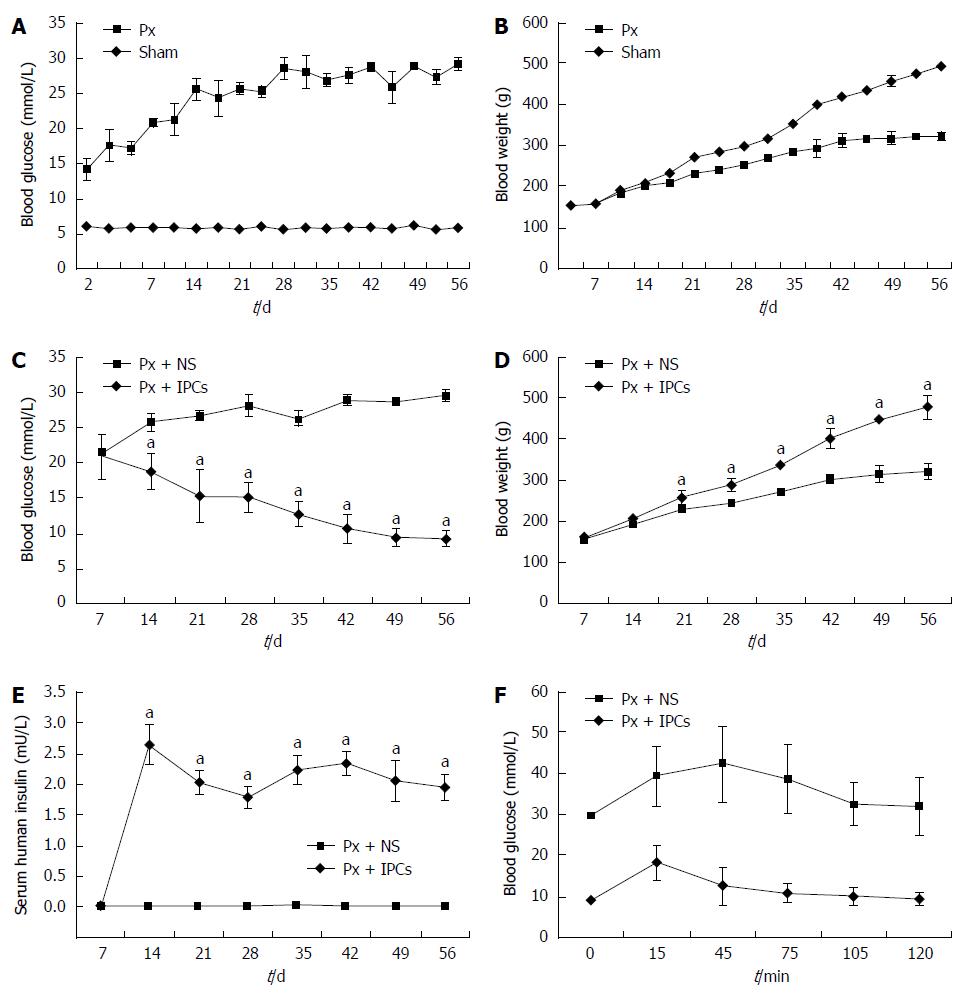
Figure 4 Blood glucose and body weight of rats after surgery.
Fed blood glucose levels and body weight in Px and sham rats following surgery A: Blood glucose level was higher in Px vs sham on day 2 following surgery and throughout the protocol (P < 0.05); B: Body weight was lower in Px vs sham on day 17 following surgery and throughout the rest of the protocol (P < 0.05). Px ( = 10); sham (n = 8); C: Blood glucose level changes of sham-treated controls (n = 8) and rats that received cell transplantation (n = 6); D: Body weight changes; E: Serum insulin levels. Results are mean ± SE. aP < 0.05 vs controls; F: Improvements in glucose tolerance in diabetic Sprague-Dawley rats transplanted with mesenchymal stem cells. At the indicated time points, blood glucose levels were measured in samples from the angular vein using a glucometer. Results are mean ± SD (n = 6).
- Citation: Yu YB, Bian JM, Gu DH. Transplantation of insulin-producing cells to treat diabetic rats after 90% pancreatectomy. World J Gastroenterol 2015; 21(21): 6582-6590
- URL: https://www.wjgnet.com/1007-9327/full/v21/i21/6582.htm
- DOI: https://dx.doi.org/10.3748/wjg.v21.i21.6582


