Copyright
©The Author(s) 2015.
World J Gastroenterol. May 28, 2015; 21(20): 6361-6373
Published online May 28, 2015. doi: 10.3748/wjg.v21.i20.6361
Published online May 28, 2015. doi: 10.3748/wjg.v21.i20.6361
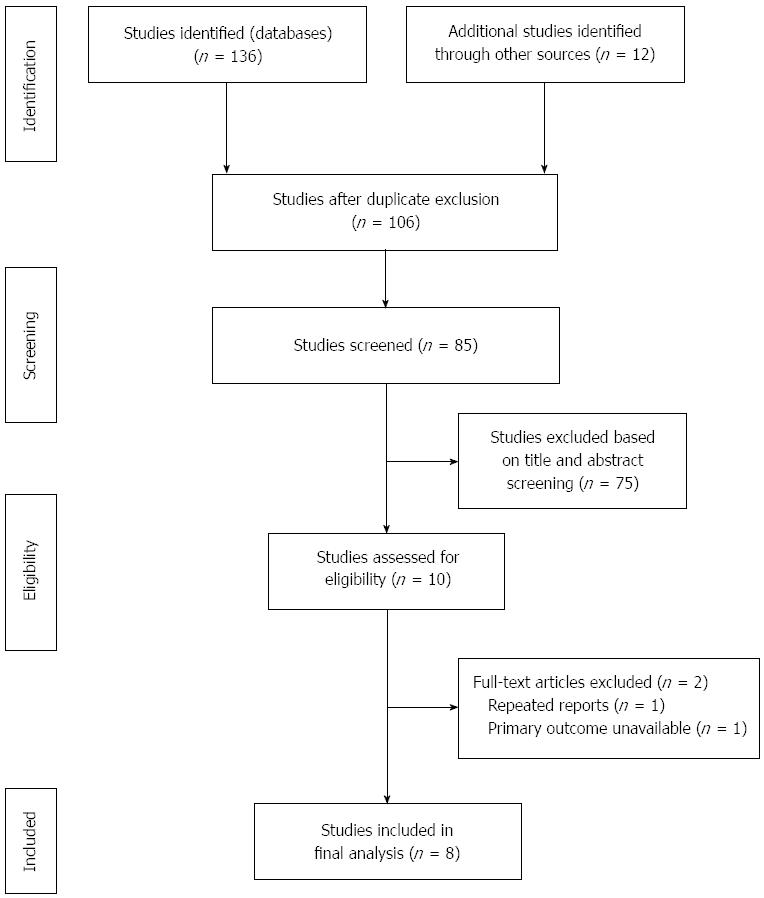
Figure 1 Flow diagram depicting the study selection process in accordance with PRISMA guidelines.
Figure 2 Forest plots demonstrating primary outcome.
Forest plots illustrating results of delayed gastric emptying in the form of meta-analysis comparing PPPD with SSPPD. Pooled odds ratios (ORs) with 95% confidence intervals (CI) were calculated using the fixed-effects model. PPPD: Pylorus preserving pancreaticoduodenectomy; SSPPD: Subtotal stomach-preserving pancreaticoduodenectomy.
Figure 3 Forest plots demonstrating secondary outcomes.
Forest plots illustrating results of operation time (A), intraoperative blood loss (B), pancreatic fistula (C), postoperative hemorrhage (D), intraabdominal abscess (E), wound infection (F), time to starting liquid diet (G), time to starting solid diet (H), period of nasogastric intubation (I), reinsertion of nasogastric tube (J), mortality (K), hospital stay (L) in the form of meta-analysis comparing PPPD with SSPPD. Pooled odds ratios (ORs) or weighted mean difference (WMD) with 95% confidence intervals (CI) were calculated using the fixed effects model or the random-effects model. PPPD: Pylorus preserving pancreaticoduodenectomy; SSPPD: Subtotal stomach-preserving pancreaticoduodenectomy.
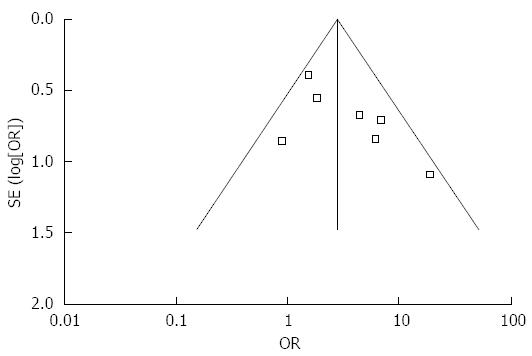
Figure 4 Funnel plot to investigate publication bias.
Funnel plot on delayed gastric emptying basing on all studies. The funnel plot revealed no publication bias.
-
Citation: Huang W, Xiong JJ, Wan MH, Szatmary P, Bharucha S, Gomatos I, Nunes QM, Xia Q, Sutton R, Liu XB. Meta-analysis of subtotal stomach-preserving pancreaticoduodenectomy
vs pylorus preserving pancreaticoduodenectomy. World J Gastroenterol 2015; 21(20): 6361-6373 - URL: https://www.wjgnet.com/1007-9327/full/v21/i20/6361.htm
- DOI: https://dx.doi.org/10.3748/wjg.v21.i20.6361


