Copyright
©The Author(s) 2015.
World J Gastroenterol. Jan 14, 2015; 21(2): 491-501
Published online Jan 14, 2015. doi: 10.3748/wjg.v21.i2.491
Published online Jan 14, 2015. doi: 10.3748/wjg.v21.i2.491
Figure 1 Determination of lentiviral titers.
Recombinant lentivirus was transfected into 293T cells to determine viral titer by the method of end-point dilution, which involves counting the numbers of infected green cells under fluorescence microscopy (original magnification x 100). The viral dilution factor was 1:1000.
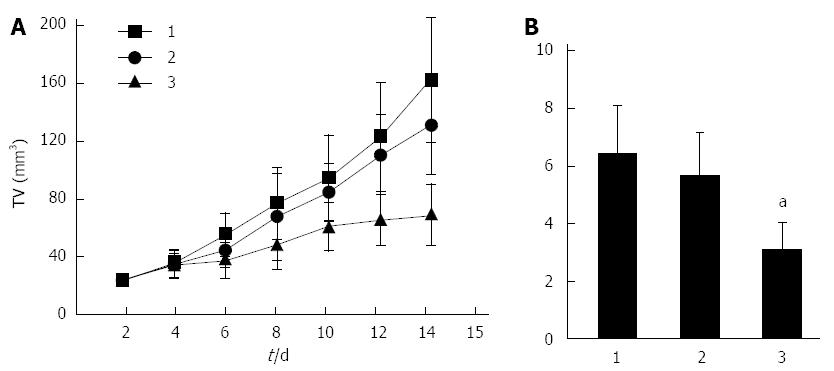
Figure 2 Overexpression of E2F-1 inhibits MGC-803 tumor growth.
A: Tumor growth curve shows the growth tendency in the LV-GFP-E2F-1 group is suppressed in comparison to the control groups; B: Relative tumor volume (TV) in LV-GFP-E2F-1-treated mice was significantly smaller than in the control groups at 12 d after tumor injection (n = 8 animals for each condition). 1, phosphate-buffered saline (PBS) control group; 2, LV-GFP-NC group; 3, LV-GFP-E2F-1 group; comparisons made using analysis of variance and Student-Newman-Keuls analyses; aP < 0.05 vs control.
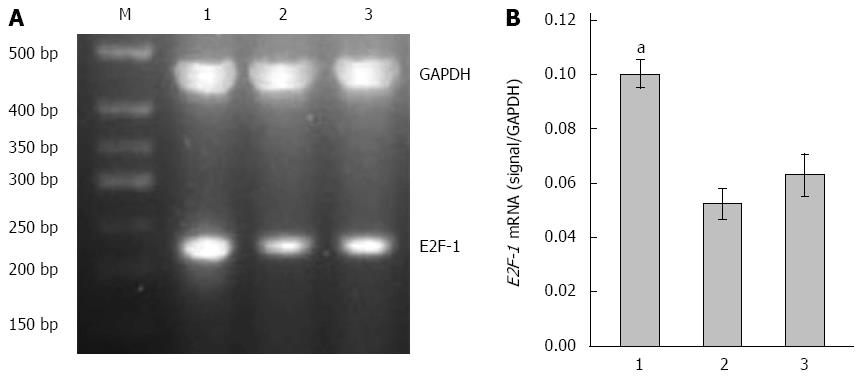
Figure 3 Overexpression of E2F-1 mRNA with LV-GFP-E2F-1.
A: Agarose gel analysis of E2F-1 and glyceraldehyde-3-phosphate dehydrogenase (GAPDH) real-time polymerase chain reaction products amplified from MGC-803 tumor tissues (M, 500 bp marker); B: Expression of E2F-1 mRNA was measured in the three groups and normalized to GAPDH (n = 8 animals for each condition). 1, LV-GFP-E2F-1 group; 2, LV-GFP-NC group; 3, phosphate buffered saline control group. aP < 0.05 using analysis of variance and Student-Newman-Keuls analyses.
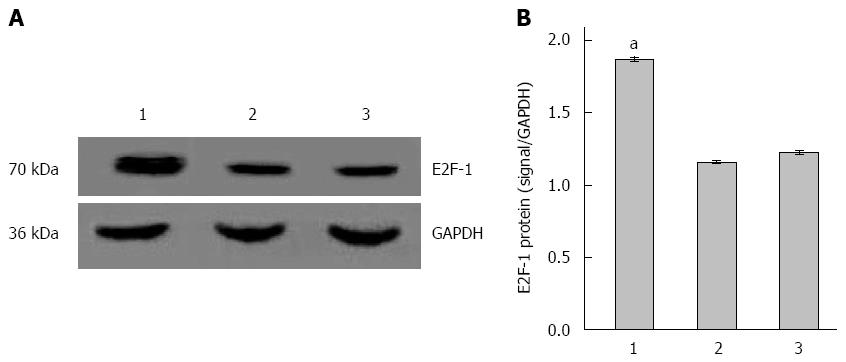
Figure 4 Overexpression of E2F-1 protein with LV-GFP-E2F-1.
A: Western blot analysis of E2F-1 and glyceraldehyde-3-phosphate dehydrogenase (GAPDH; internal control) in MGC-803 tumor tissue; B: Expression of E2F-1 protein was measured in the three groups normalized to GAPDH (n = 8 animals for each condition). 1, LV-GFP-E2F-1 group; 2, LV-GFP-NC group; 3, PBS group. aP < 0.05 using analysis of variance and Student-Newman-Keuls analyses.
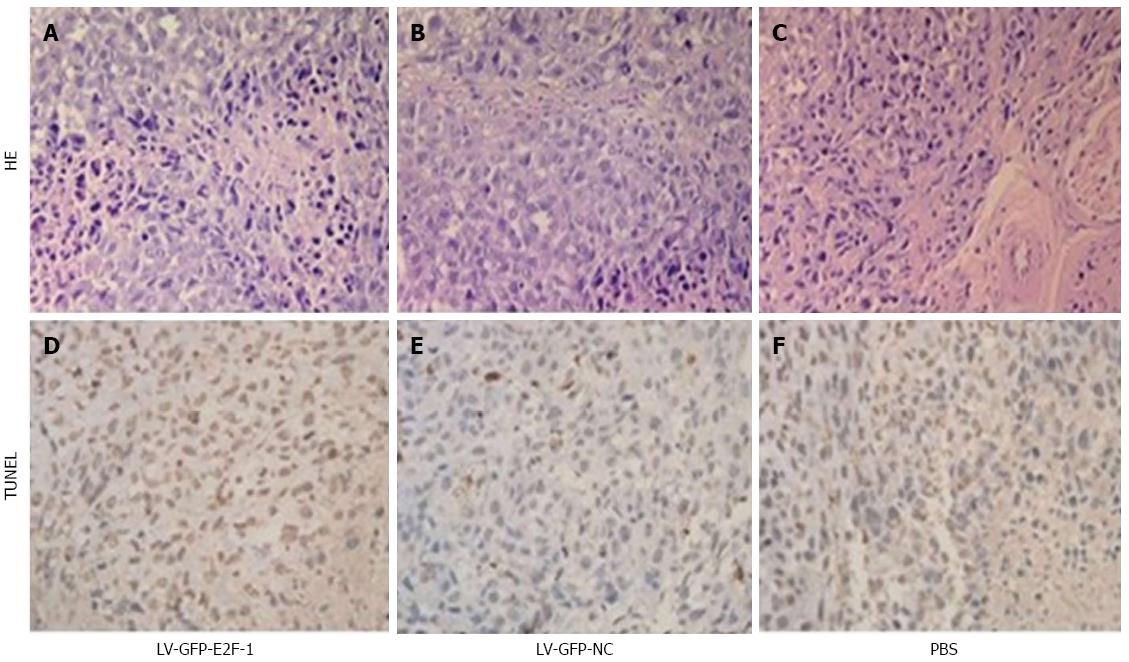
Figure 5 Overexpression of E2F-1 induces in situ MGC-803 tumor cell apoptosis.
Apoptosis was assessed by terminal deoxynucleotidyl transferase-mediated dUTP-biotin nick end labeling (TUNEL) and hematoxylin and eosin staining. More apoptotic MGC-803 tumor cells were observed in the LV-GFP-E2F-1 group than in the LV-GFP-NC and phosphate buffered saline (PBS) groups (original magnification, × 400).
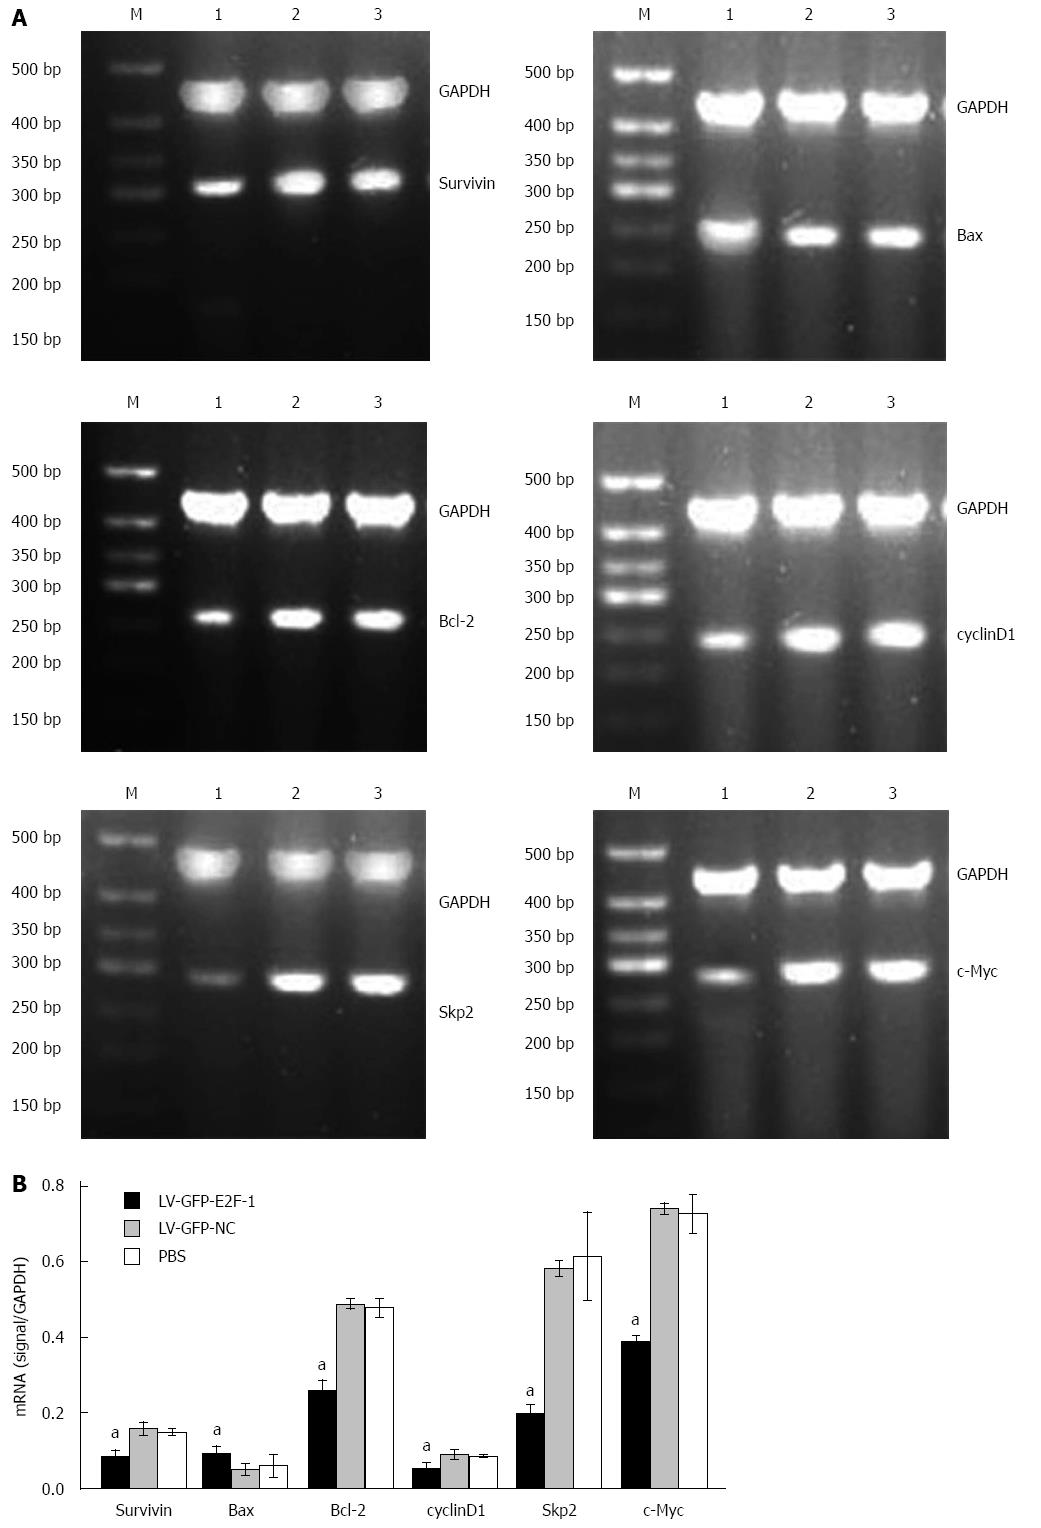
Figure 6 Overexpression of E2F-1 alters mRNA expression of apoptosis regulators.
A: Agarose gel analysis of semiquantitative real-time polymerase chain reactions for c-Myc, S-phase kinase-associated protein 2 (Skp2), Bcl-2, cyclin D1, survivin, Bax and glyceraldehydes-3-phosphate dehydrogenase (GAPDH) in the MGC-803 tumor tissues. Lanes: 1, LV-GFP-E2F-1 group; 2, LV-GFP-NC group; 3, phosphate-buffered saline (PBS) group; M, 500 bp marker; B: Quantification showing downregulation of c-Myc, Skp2, Bcl-2, cyclin D1, survivin and upregulation of Bax mRNA levels (n = 8 animals for each condition). aP < 0.05 using analysis of variance and Student-Newman-Keuls analyses.
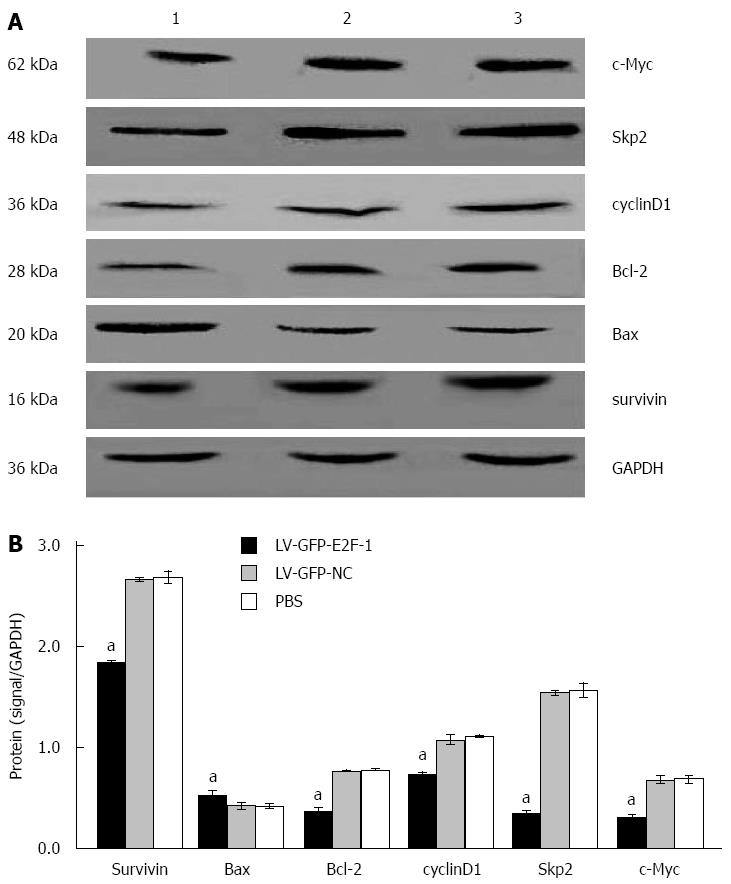
Figure 7 Overexpression of E2F-1 alters protein expression of apoptosis regulators.
A: Western blot analysis of c-Myc, S-phase kinase-associated protein 2 (Skp2), Bcl-2, cyclin D1, survivin, Bax and glyceraldehyde-3-phosphate dehydrogenase (GAPDH; internal control) in the MGC-803 tumor tissues. Lanes: 1, LV-GFP-E2F-1 group; 2, LV-GFP-NC group; 3, phosphate-buffered saline (PBS) group; B: Quantification showing downregulation c-Myc, Skp2, Bcl-2, cyclin D1, survivin and upregulation of Bax protein levels (n = 8 animals for each condition). aP < 0.05 using analysis of variance and Student-Newman-Keuls analysis.
-
Citation: Wei WY, Yan LH, Wang XT, Li L, Cao WL, Zhang XS, Zhan ZX, Yu H, Xie YB, Xiao Q. E2F-1 overexpression inhibits human gastric cancer MGC-803 cell growth
in vivo . World J Gastroenterol 2015; 21(2): 491-501 - URL: https://www.wjgnet.com/1007-9327/full/v21/i2/491.htm
- DOI: https://dx.doi.org/10.3748/wjg.v21.i2.491


