Copyright
©The Author(s) 2015.
World J Gastroenterol. May 21, 2015; 21(19): 6088-6096
Published online May 21, 2015. doi: 10.3748/wjg.v21.i19.6088
Published online May 21, 2015. doi: 10.3748/wjg.v21.i19.6088
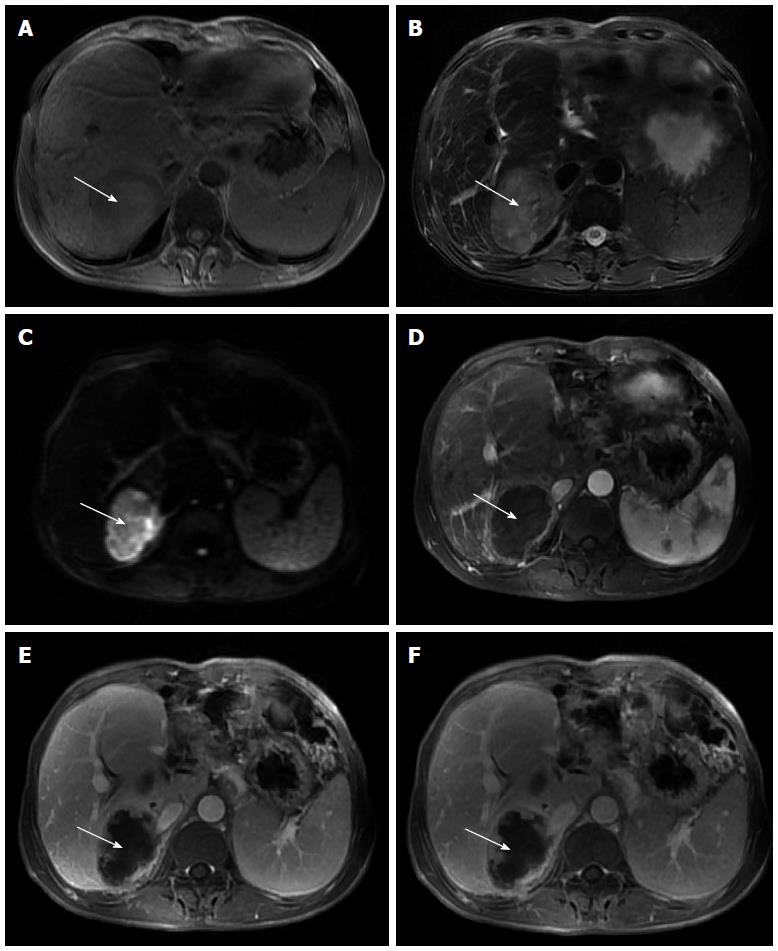
Figure 1 Magnetic resonance imaging.
A: Markedly heterogeneous low signal intensity mass (white arrow) in the right lobe of the liver on T1-weighted imaging, with focal areas of high signal intensity that indicate fresh hemorrhage; B: Heterogeneous high signal intensity mass (white arrow) in the right lobe of the liver on T2-weighted imaging, with focal areas of higher signal intensity that indicate necrosis or hemorrhage; C: Mass (white arrow) shows high signal intensity on diffusion-weighted imaging that reveals restricted diffusion; D: Mass (white arrow) has a ring-like enhancement in the arterial phase; E: Progressive enhancement of the ring (white arrow) in the portal phase, revealing nodular enhanced foci within the ring; F: Progressive enhancement of the ring (white arrow) and nodular enhanced foci within the ring in the delayed phase.
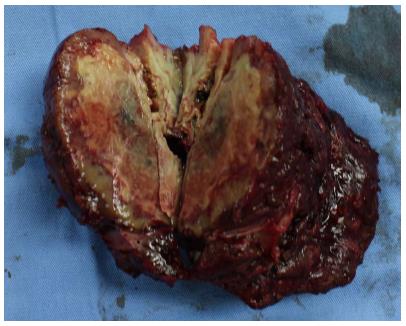
Figure 2 Cross-section of the specimen showing a yellow-white lesion 6.
3 cm × 4.5 cm.
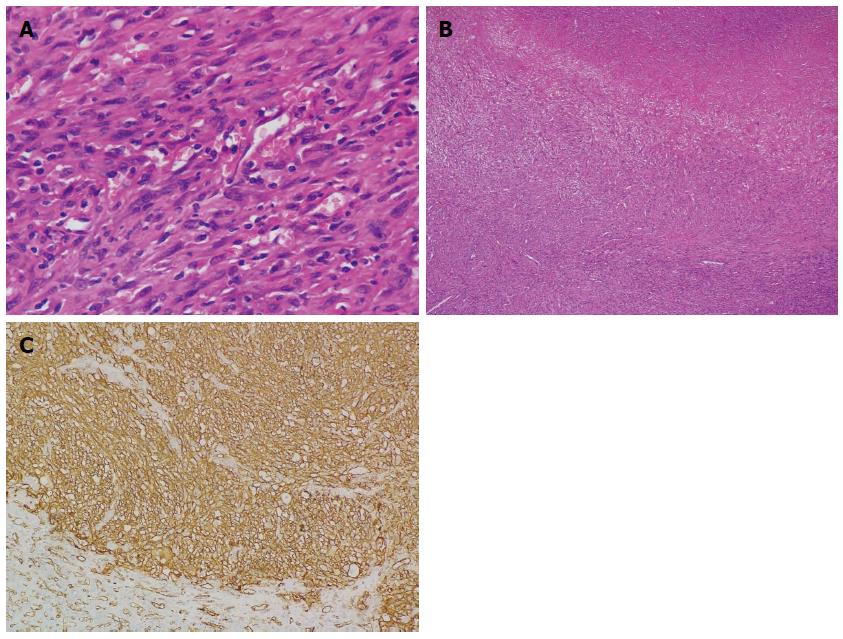
Figure 3 Histological examination.
A: Spindle-shaped neoplastic cells exhibiting marked nuclear pleomorphism with whorled shape and fascicular clusters (HE stain; magnification × 400); B: Necrotic areas seen between the clusters of neoplastic cells (HE stain; magnification × 40); C: Immunohistochemical examination reveals positive staining of CD31 (magnification × 200). HE: Hematoxylin and eosin.
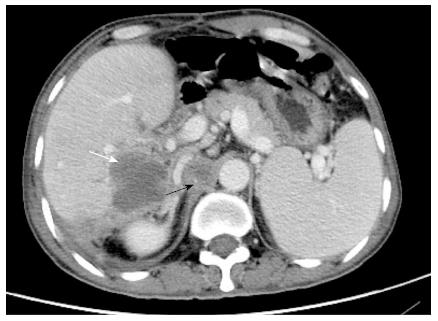
Figure 4 Computed tomography imaging.
Emerging lesions in the right liver (white arrow) and enlarged retroperitoneal lymph nodes (black arrow) suggested postoperative tumor recurrence.
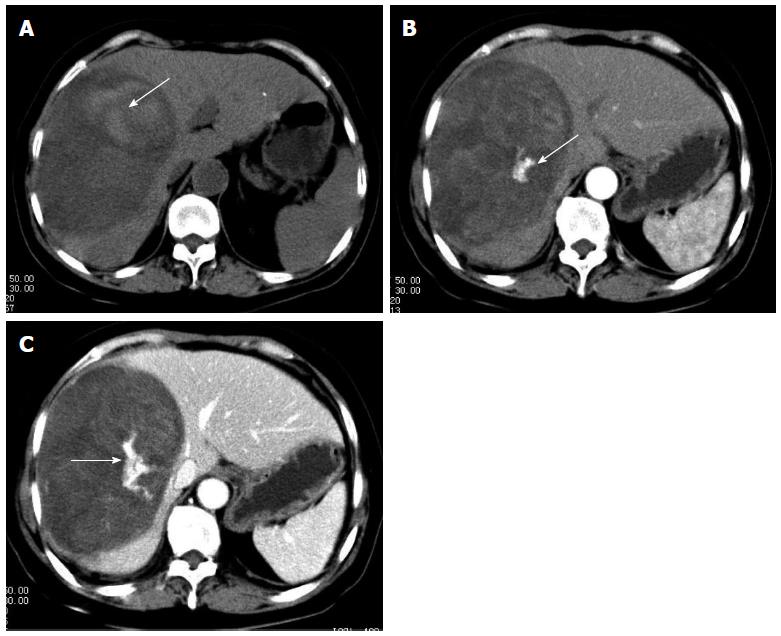
Figure 5 Computed tomography scan.
A: Plain computed tomography scan reveals an oval shaped heterogeneous hypoattenuating mass with hyperattenuating foci (arrow) which suggests hemorrhage; B: Dominant mass lesion shows heterogenous enhancement with hyperattenuating enhanced foci (arrow), which indicate vasculature, in arterial phase; C: Dominant mass shows progressive enhancement and hyperattenuating enhanced foci enlarged in portal phase (arrows).
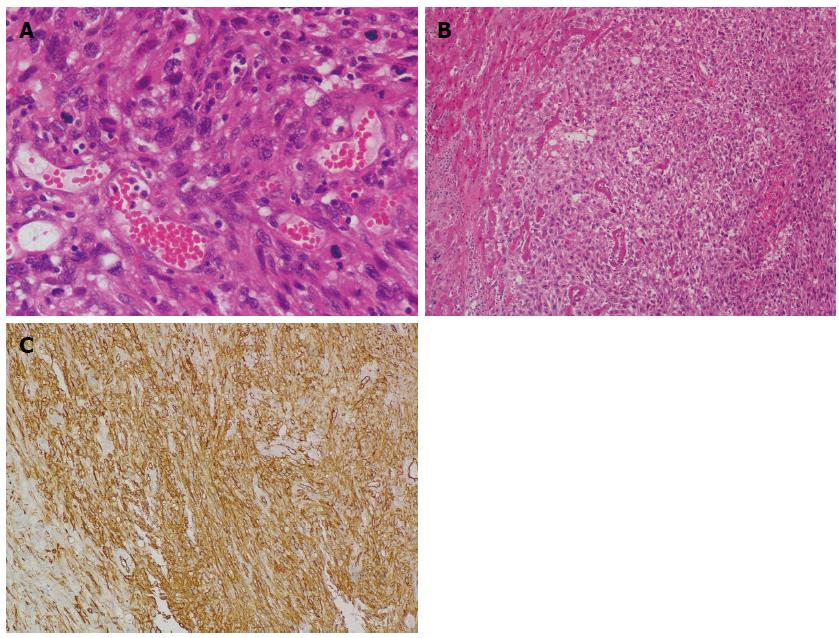
Figure 6 Histological examination.
A: Neoplastic cells exhibiting marked nuclear pleomorphism, and vascular channels filled with erythrocytes (HE stain; magnification × 400); B: Clusters of neoplastic cells infiltrating liver parenchyma (HE stain; magnification × 100); C: Immunohistochemical examination reveals positive staining of CD34 (magnification × 200). HE: Hematoxylin and eosin.
- Citation: Zhu YP, Chen YM, Matro E, Chen RB, Jiang ZN, Mou YP, Hu HJ, Huang CJ, Wang GY. Primary hepatic angiosarcoma: A report of two cases and literature review. World J Gastroenterol 2015; 21(19): 6088-6096
- URL: https://www.wjgnet.com/1007-9327/full/v21/i19/6088.htm
- DOI: https://dx.doi.org/10.3748/wjg.v21.i19.6088


