Copyright
©The Author(s) 2015.
World J Gastroenterol. May 21, 2015; 21(19): 5901-5909
Published online May 21, 2015. doi: 10.3748/wjg.v21.i19.5901
Published online May 21, 2015. doi: 10.3748/wjg.v21.i19.5901
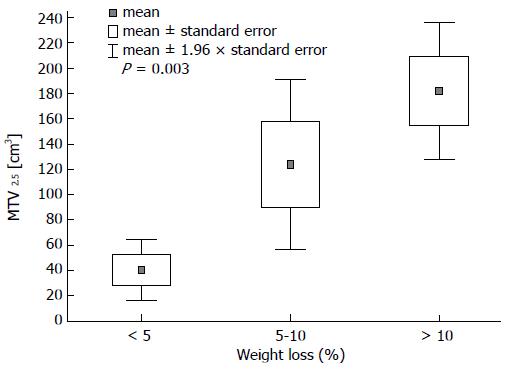
Figure 1 Box plot of MTV2.
5 values of patients grouped by extent of weight loss.
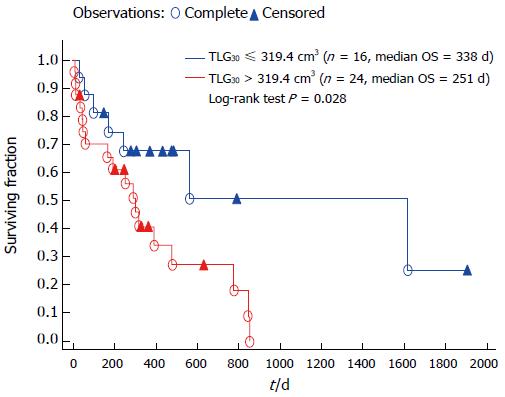
Figure 2 Kaplan-Meier curves for overall survival of patient groups stratified by ROC-calculated threshold for TLG30.
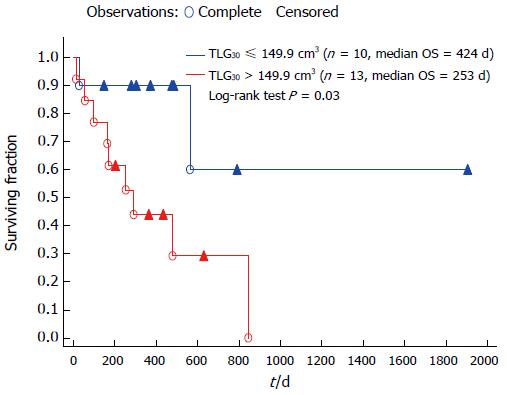
Figure 3 Kaplan-Meier curves for overall survival of patient groups stratified by ROC-calculated threshold for TLG30 (including only patients who were not disseminated initially).
- Citation: Grabinska K, Pelak M, Wydmanski J, Tukiendorf A, d’Amico A. Prognostic value and clinical correlations of 18-fluorodeoxyglucose metabolism quantifiers in gastric cancer. World J Gastroenterol 2015; 21(19): 5901-5909
- URL: https://www.wjgnet.com/1007-9327/full/v21/i19/5901.htm
- DOI: https://dx.doi.org/10.3748/wjg.v21.i19.5901


