Copyright
©The Author(s) 2015.
World J Gastroenterol. May 21, 2015; 21(19): 5877-5883
Published online May 21, 2015. doi: 10.3748/wjg.v21.i19.5877
Published online May 21, 2015. doi: 10.3748/wjg.v21.i19.5877
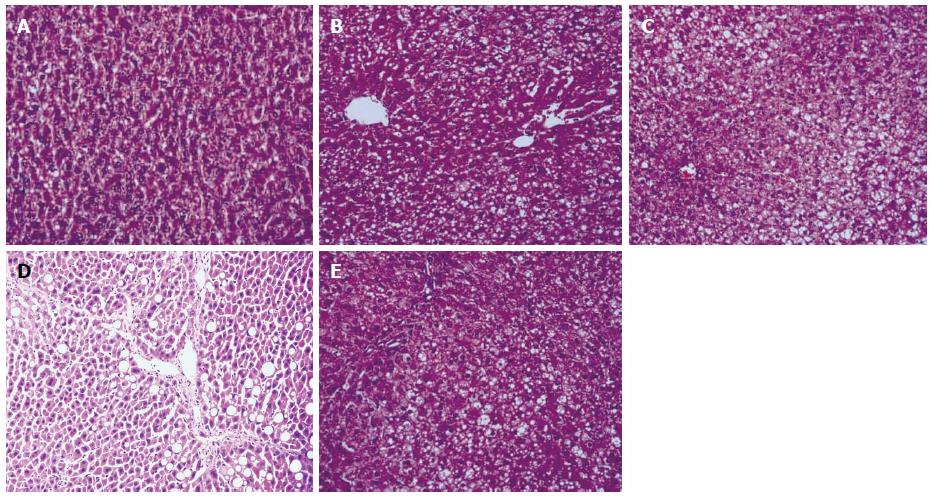
Figure 1 Histopathological results in the liver (hematoxylin and eosin staining, magnification × 100).
A: The control group; B: The model group at the end of the 6th week; C: The model group at the end of the 10th week; D: The model group at the end of the 14th week; E: The intervention group at the end of the 14th week.
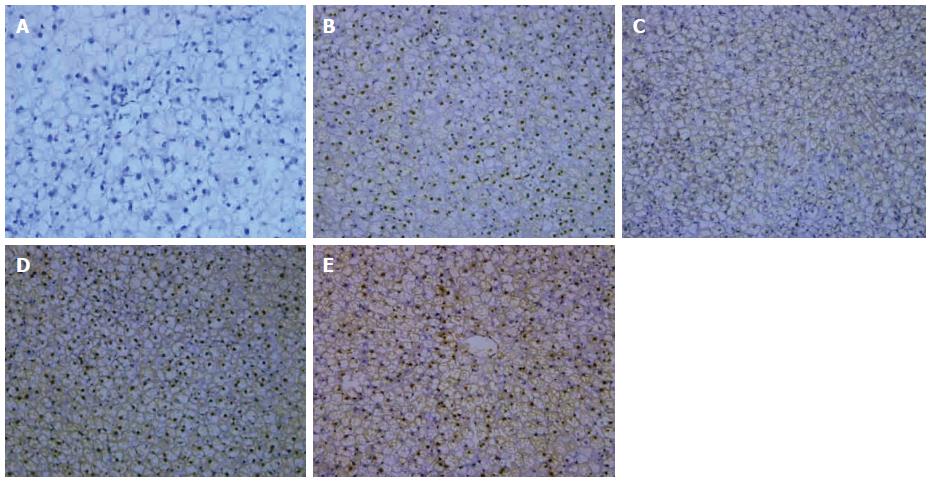
Figure 2 Immunohistochemical staining for nuclear factor-κB protein expression (SP, magnification × 200).
A: The control group; B: The model group at the end of the 6th week; C: The model group at the end of the 10th week; D: The model group at the end of the 14th week; E: The intervention group at the end of the 14th week.
- Citation: Tan DY, Shi HY, Li CP, Zhong XL, Kang M. Effect of nuclear factor-κB and angiotensin II receptor type 1 on the pathogenesis of rat non-alcoholic fatty liver disease. World J Gastroenterol 2015; 21(19): 5877-5883
- URL: https://www.wjgnet.com/1007-9327/full/v21/i19/5877.htm
- DOI: https://dx.doi.org/10.3748/wjg.v21.i19.5877


