Copyright
©The Author(s) 2015.
World J Gastroenterol. May 21, 2015; 21(19): 5831-5842
Published online May 21, 2015. doi: 10.3748/wjg.v21.i19.5831
Published online May 21, 2015. doi: 10.3748/wjg.v21.i19.5831
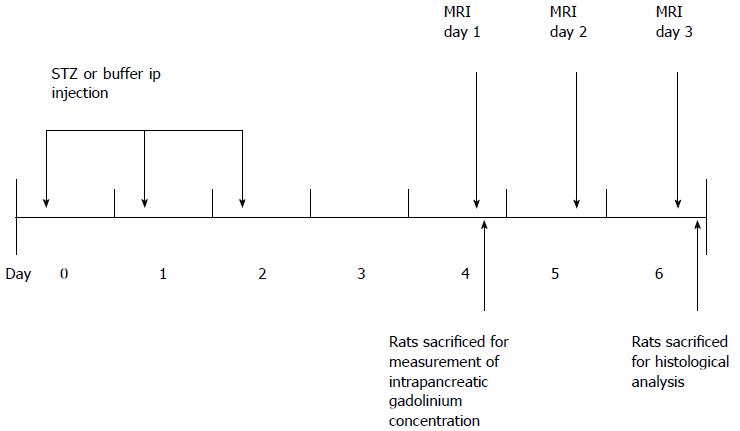
Figure 1 Experimental design.
MRI: Magnetic resonance imaging; STZ: Streptozotocin.
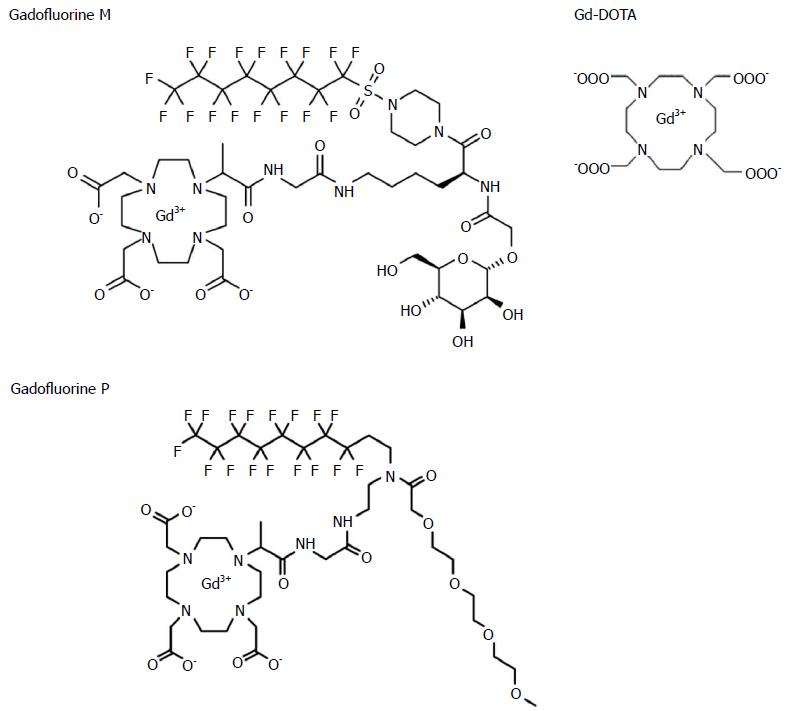
Figure 2 Structures of Gadofluorine M, Gadofluorine P, and Gd-DOTA.
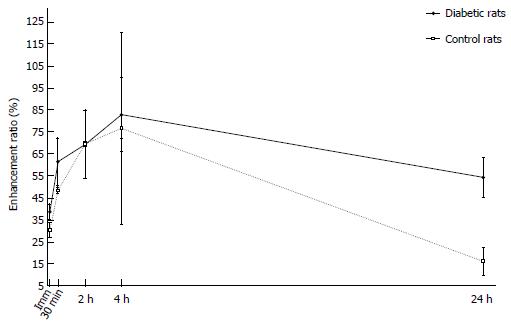
Figure 3 Time-enhancement ratio curve pattern of Gadofluorine P.
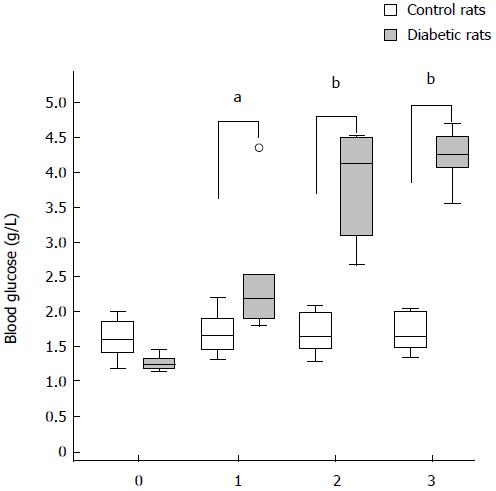
Figure 4 Blood glucose level of the streptozotocin-injected rat model of type 1 diabetes.
Blood glucose level of the control (n = 5) and diabetic (n = 6) rat groups over 4 d. The blood glucose level increased more than 2 g/L from day 2 in the diabetic rat group. aP < 0.05 control rats vs diabetic rats; bP < 0.01 control rats vs diabetic rats.
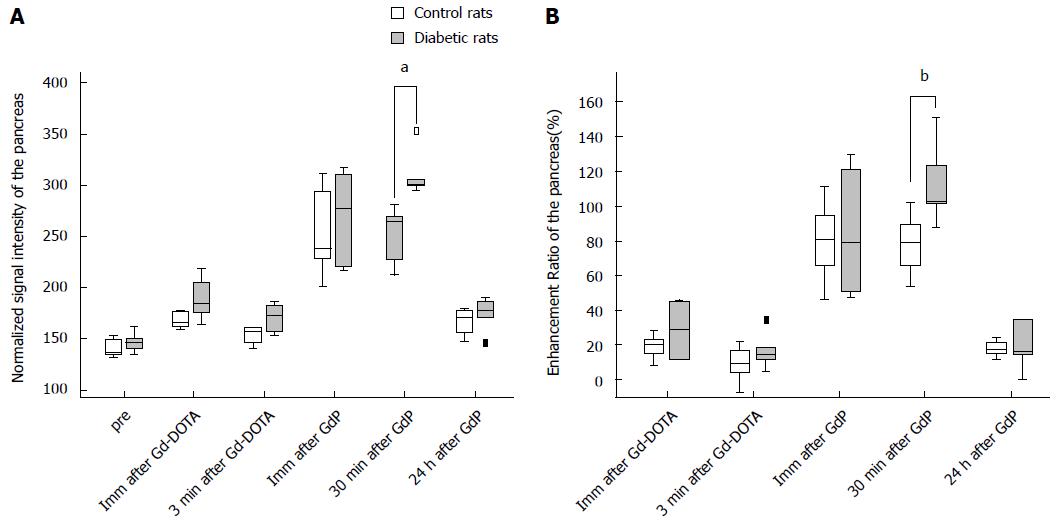
Figure 5 Enhancement of the pancreata of the control and diabetic rats.
The normalized signal intensity (SI) (A) and enhancement ratio (ER) (B) of the pancreata at each time point after the injection of Gd-DOTA and Gadofluorine P in the control (n = 5) and diabetic (n = 6) rat groups (bP < 0.01). Imm, immediate. aP < 0.05 control rats vs diabetic rats; bP < 0.01 control rats vs diabetic rats. GdP: Gadofluorine P.
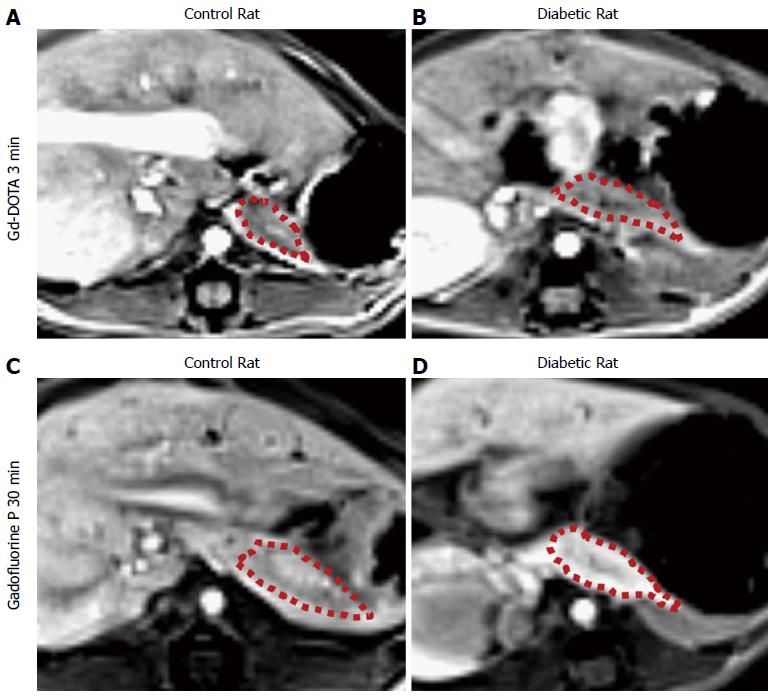
Figure 6 T1-weighted image magnetic resonance imaging obtained 3 min after Gd-DOTA injection and 30 min after Gadofluorine P injection and a diabetic rat (D) revealed the pancreas of a control rat (A), a diabetic rat (B), a control rat (C) and a diabetic rat (D), respectively.
The normalized SI and ER were as follows: a control vs a diabetic rat, 158.2 vs 153.2 and 14.7 vs 4.9, respectively. The normalized SI and ER were as follows: a control versus a diabetic rat, 212.5 vs 295.6 and 54.1 vs 102.3, respectively. The area of the pancreas is outlined with a red dotted line. MRI: Magnetic resonance imaging; SI: Signal intensity; ER: Enhancement ratio.
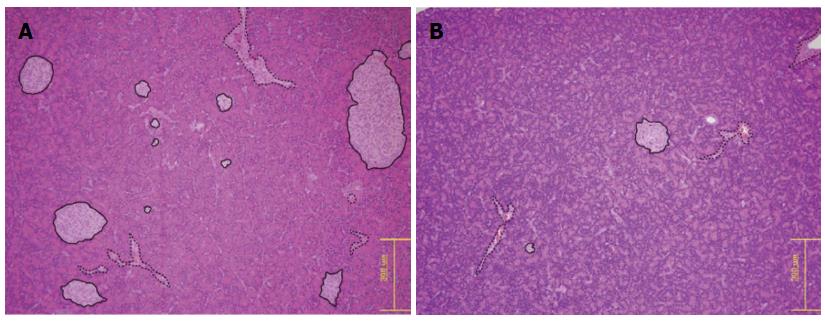
Figure 7 Hematoxylin and eosin staining of the pancreas of a control rat and a diabetic rat.
A light microscope at magnification × 100. All islets are outlined with solid lines, and the structures outlined with dotted line are the vessels. Both the islet size and the islet number were decreased in the diabetic rats (B) compared with the control rats (A).
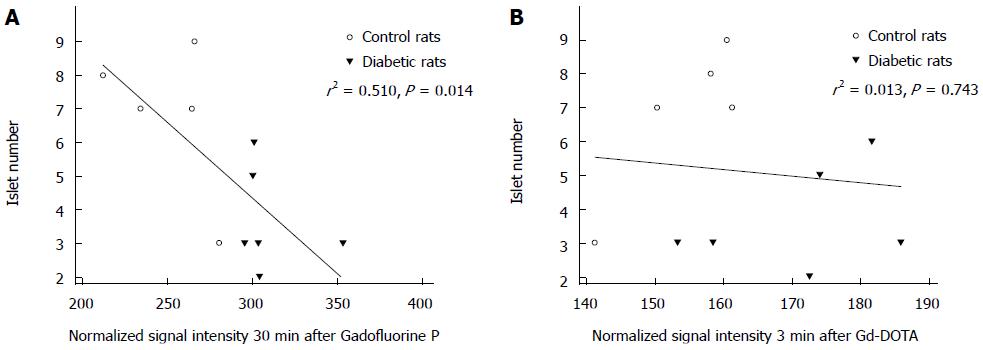
Figure 8 Correlation of magnetic resonance parameters of the pancreas after Gadofluorine P injection with islet number.
A: Normalized signal intensity of the pancreas at 30 min after Gadofluorine P injection correlated well with the mean number of islet per field (r2 = 0.510, P = 0.014); B: Normalized signal intensity of the pancreas at 3 min after Gd-DOTA injection did not correlated with the mean number of islets per field (r2 = 0.013, P = 0.743).
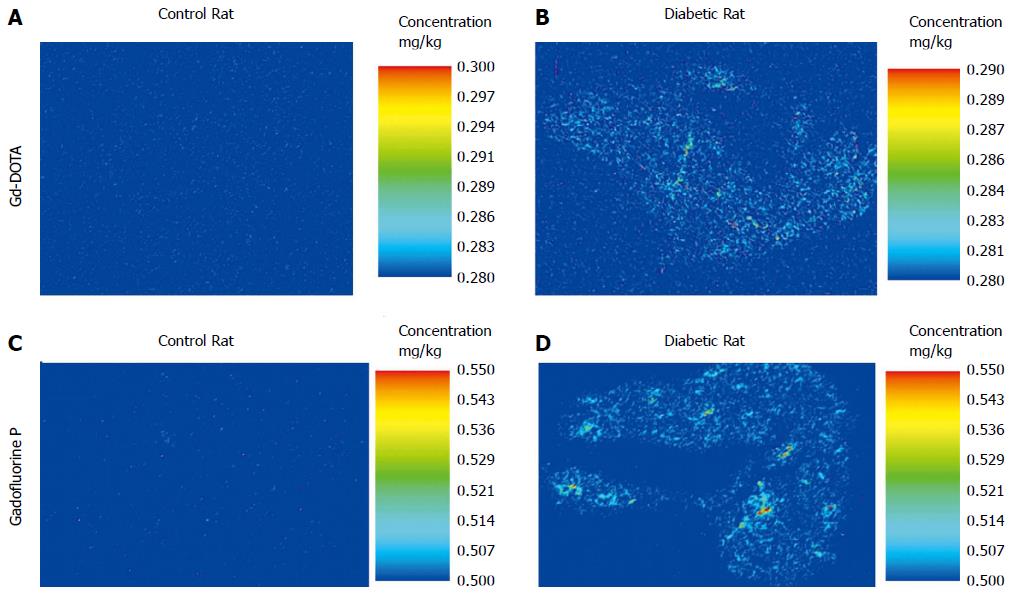
Figure 9 Determination of intra-pancreatic Gadolinium concentration using laser ablation-inductively coupled plasma-mass spectrometry.
Higher average Gadolinium concentration (10.49 ng/g) in the pancreas section of a diabetic rat (A) than a control rat (3.89 ng/g) (B) 30 min after Gadofluoine P injection. The average Gadolinium concentration was 0 ng/g in a control rat (C) and 1.55 ng/g in a diabetic rat (D).
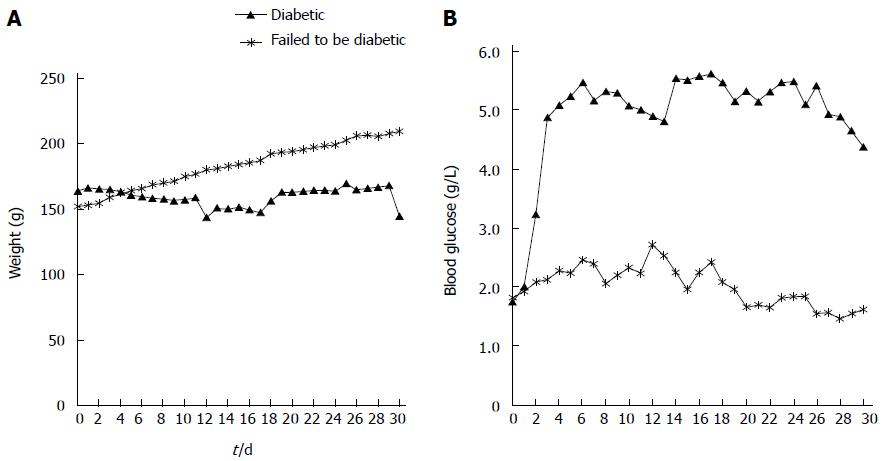
Figure 10 Thirty days’ monitoring of body weight (A) and blood glucose level (B) of rats with streptozotocin intraperitoneal injection.
Nine separate rats were treated with streptozotocin in the same way as the material and method. They are monitored for blood glucose level and weight for 30 d. Among them, two rats failed to develop hyperglycemia. In diabetic rats, blood glucose level was elevated and plateaued above 4.5 g/dL from day 3.
- Citation: Cho HR, Lee Y, Doble P, Bishop D, Hare D, Kim YJ, Kim KG, Jung HS, Park KS, Choi SH, Moon WK. Magnetic resonance imaging of the pancreas in streptozotocin-induced diabetic rats: Gadofluorine P and Gd-DOTA. World J Gastroenterol 2015; 21(19): 5831-5842
- URL: https://www.wjgnet.com/1007-9327/full/v21/i19/5831.htm
- DOI: https://dx.doi.org/10.3748/wjg.v21.i19.5831


