Copyright
©The Author(s) 2015.
World J Gastroenterol. May 14, 2015; 21(18): 5668-5676
Published online May 14, 2015. doi: 10.3748/wjg.v21.i18.5668
Published online May 14, 2015. doi: 10.3748/wjg.v21.i18.5668
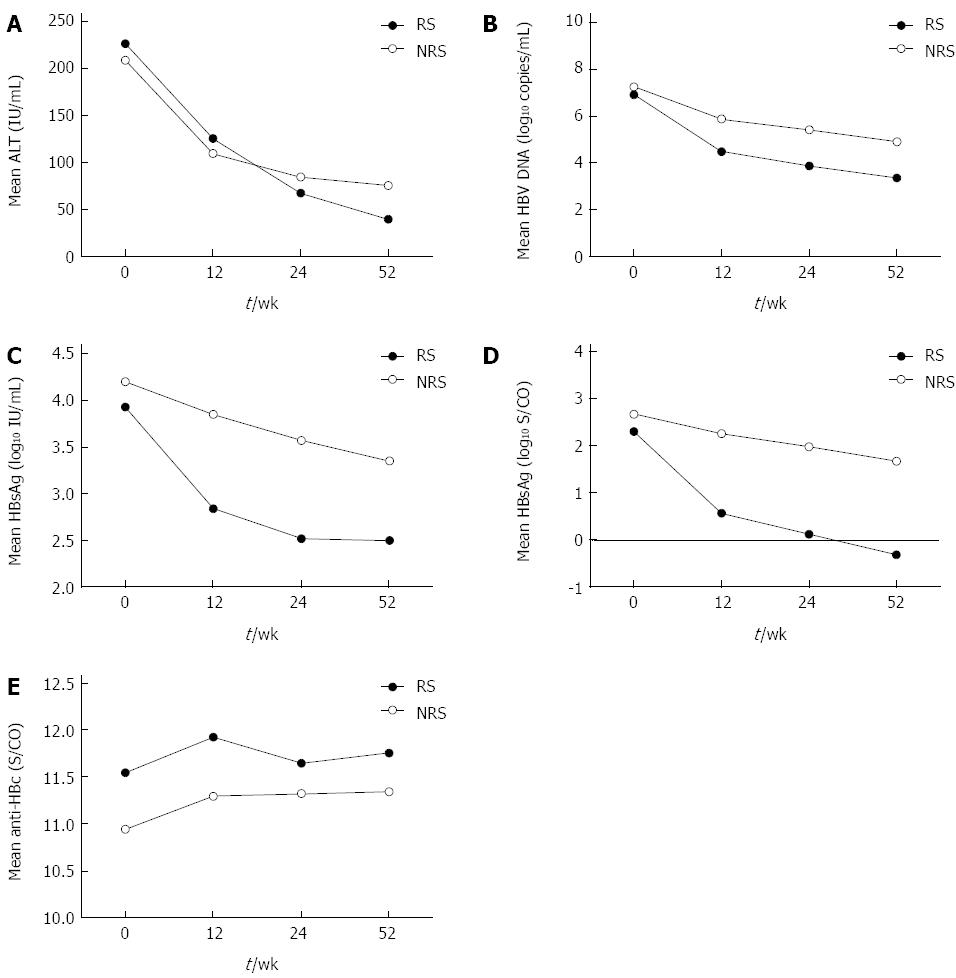
Figure 1 Quantitative changes in biochemical and virus markers in chronic hepatitis B patients after interferon therapy.
A: ALT levels; B: HBV DNA levels; C: HBsAg levels; D: HBeAg levels; E: Anti-HBc levels. ALT: Alanine aminotransferase; HBV: Hepatitis B virus; HBsAg: Hepatitis B surface antigen; HBeAg: Hepatitis B e antigen; anti-HBc: Antibody to hepatitis B core antigen.
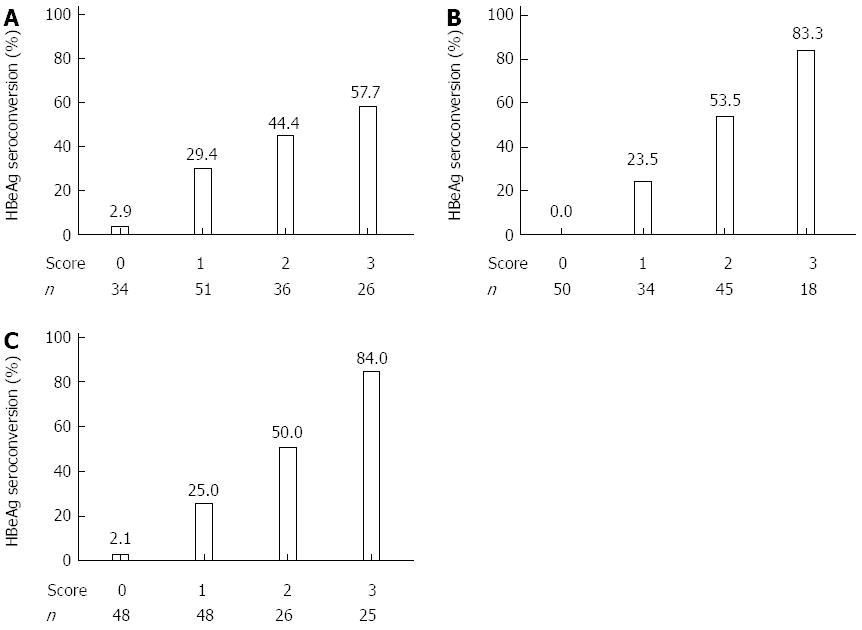
Figure 2 Predictive models at baseline, 12, and 24 wk for hepatitis B e antigen seroconversion by 52 wk in hepatitis B e antigen-positive patients treated with interferon-α.
A: Baseline; B: 12 wk; C: 24 wk. A change in each analyzed variable was assigned a score of 1. A score of 0 was given if patients did not have changes in any of the analyzed variables. The 3 factors correlating most with hepatitis B e antigen (HBeAg) seroconversion at each time point were used to build models to predict the outcome after interferon-α treatment.
- Citation: Wang CT, Zhang YF, Sun BH, Dai Y, Zhu HL, Xu YH, Lu MJ, Yang DL, Li X, Zhang ZH. Models for predicting hepatitis B e antigen seroconversion in response to interferon-α in chronic hepatitis B patients. World J Gastroenterol 2015; 21(18): 5668-5676
- URL: https://www.wjgnet.com/1007-9327/full/v21/i18/5668.htm
- DOI: https://dx.doi.org/10.3748/wjg.v21.i18.5668


