Copyright
©The Author(s) 2015.
World J Gastroenterol. May 14, 2015; 21(18): 5465-5472
Published online May 14, 2015. doi: 10.3748/wjg.v21.i18.5465
Published online May 14, 2015. doi: 10.3748/wjg.v21.i18.5465
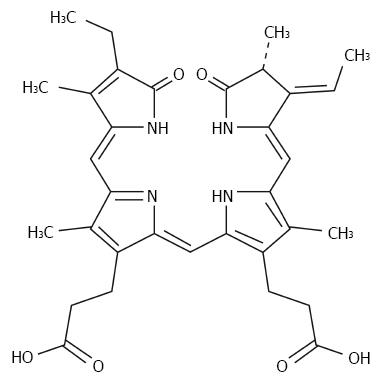
Figure 1 Chemical structure of phycocyanobilin.
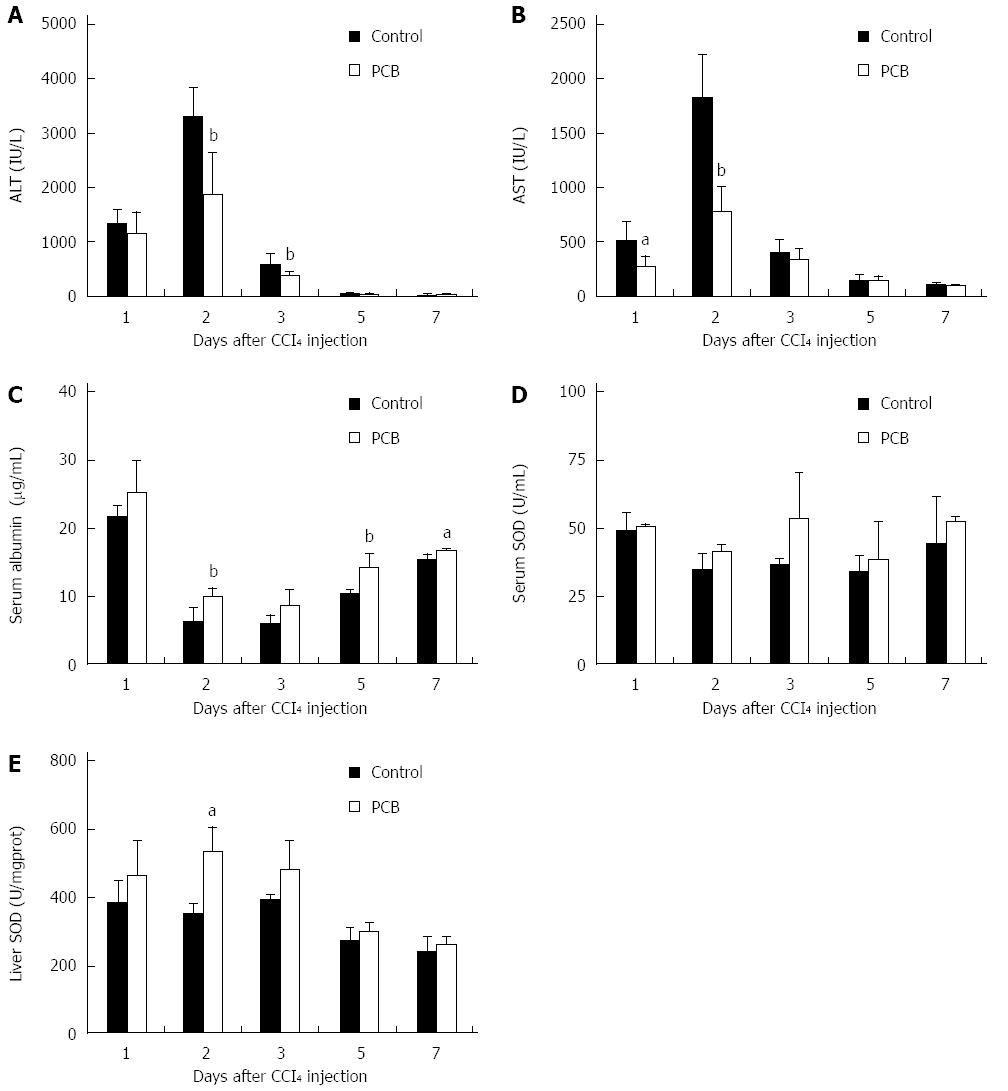
Figure 2 Phycocyanobilin protects mice against acute hepatocellular damage.
After CCl4 injection, mice were intragastrically administered with PCB or CMC-Na solution only. Then serum ALT, AST, albumin, SOD and liver SOD of mice were measured at indicated time points to monitor the indicator change-related acute hepatocellular damage. A: Serum ALT; B: Serum AST; C: Serum Albumin; D: Serum SOD; E: Liver SOD. Values represent mean ± SE (n = 6). aP < 0.05, bP < 0.01 vs control. PCB: Phycocyanobilin; ALT: Alanine aminotransferase; AST: Aspartate aminotransferase; SOD: Superoxide dismutase; CMC-Na: Sodium carboxymethylcellulose.
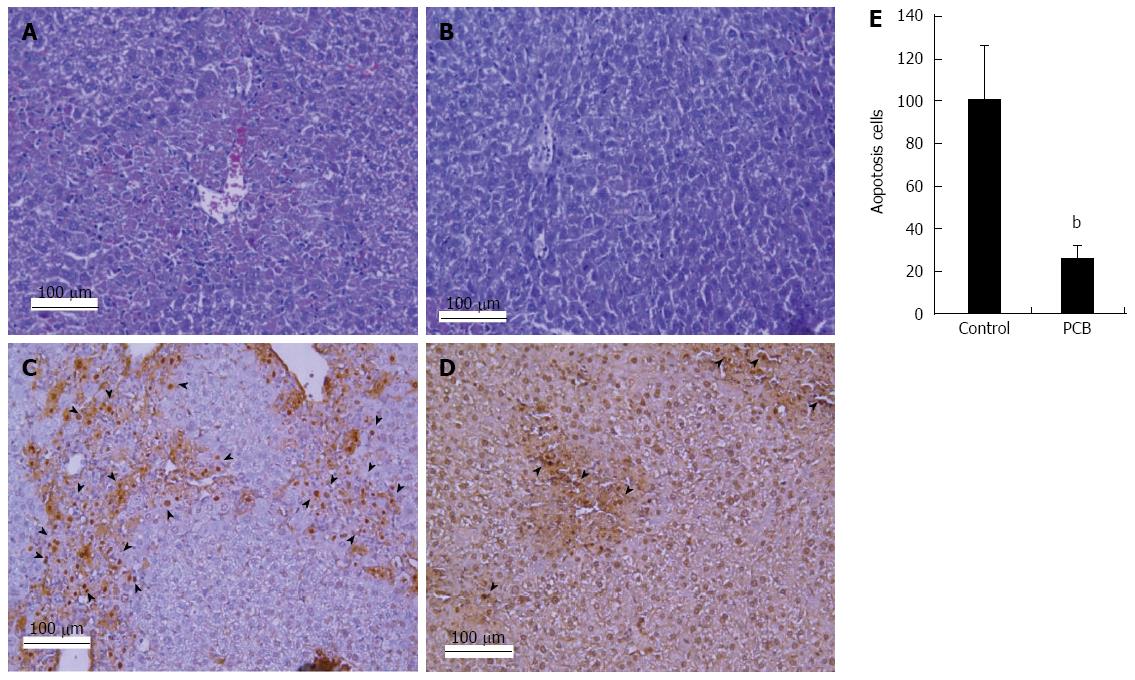
Figure 3 Phycocyanobilin reduces hepatocellular necrosis and apoptosis.
A: Liver section of control group stained with HE at day 2 after CCl4 injection of mice, showing partial necrosis with clusters of inflammatory cells around central vein; B: Liver section of PCB group stained with HE at day 2 after CCl4 injection of mice, demonstrating decreased inflammatory cells and histological recovery compared with control group. In the TUNEL assay earthy yellow cells indicate apoptotic cells; C: The control group; D: PCB treated group; E: Demonstrated numbers of apoptotic cells. At least six 12 mm2 tissue sections were counted for each group. Values represent mean ± SE (n = 6), bP < 0.01 vs control.
Figure 4 Pathway of phycocyanobilin-accelerated liver regeneration.
A-E: Results of real-time quantitative PCR detection at 1, 2, 3 and 5 d after CCl4 treament. A: The expression of HGF; B: The expression of TGF-α; C: The expression of TGF-β; D: The expression of TNF-α; E: The expression of IL-6; F: The western blotting result of PCNA, TNF-α, and cytochrome C in liver tissue. C1-C5 indicates the results of the control group from day 1 to day 5, D1-D5 indicates the results of the PCB group from day 1 to day 5. aP < 0.05, bP < 0.01 and dP < 0.001 vs control.
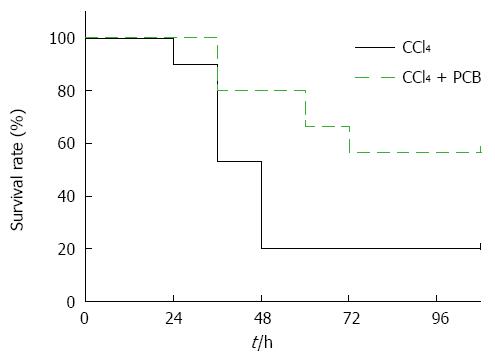
Figure 5 Survival rate after a lethal dose treatment with CCl4.
The survival curves of the different conditions are shown (n = 30/group). The solid line indicates the survival rate of the control group, the dashed line indicates the survival rate of the PCB group over 108 h after CCl4 injection.
- Citation: Liu J, Zhang QY, Yu LM, Liu B, Li MY, Zhu RZ. Phycocyanobilin accelerates liver regeneration and reduces mortality rate in carbon tetrachloride-induced liver injury mice. World J Gastroenterol 2015; 21(18): 5465-5472
- URL: https://www.wjgnet.com/1007-9327/full/v21/i18/5465.htm
- DOI: https://dx.doi.org/10.3748/wjg.v21.i18.5465


