Copyright
©The Author(s) 2015.
World J Gastroenterol. Apr 21, 2015; 21(15): 4620-4626
Published online Apr 21, 2015. doi: 10.3748/wjg.v21.i15.4620
Published online Apr 21, 2015. doi: 10.3748/wjg.v21.i15.4620
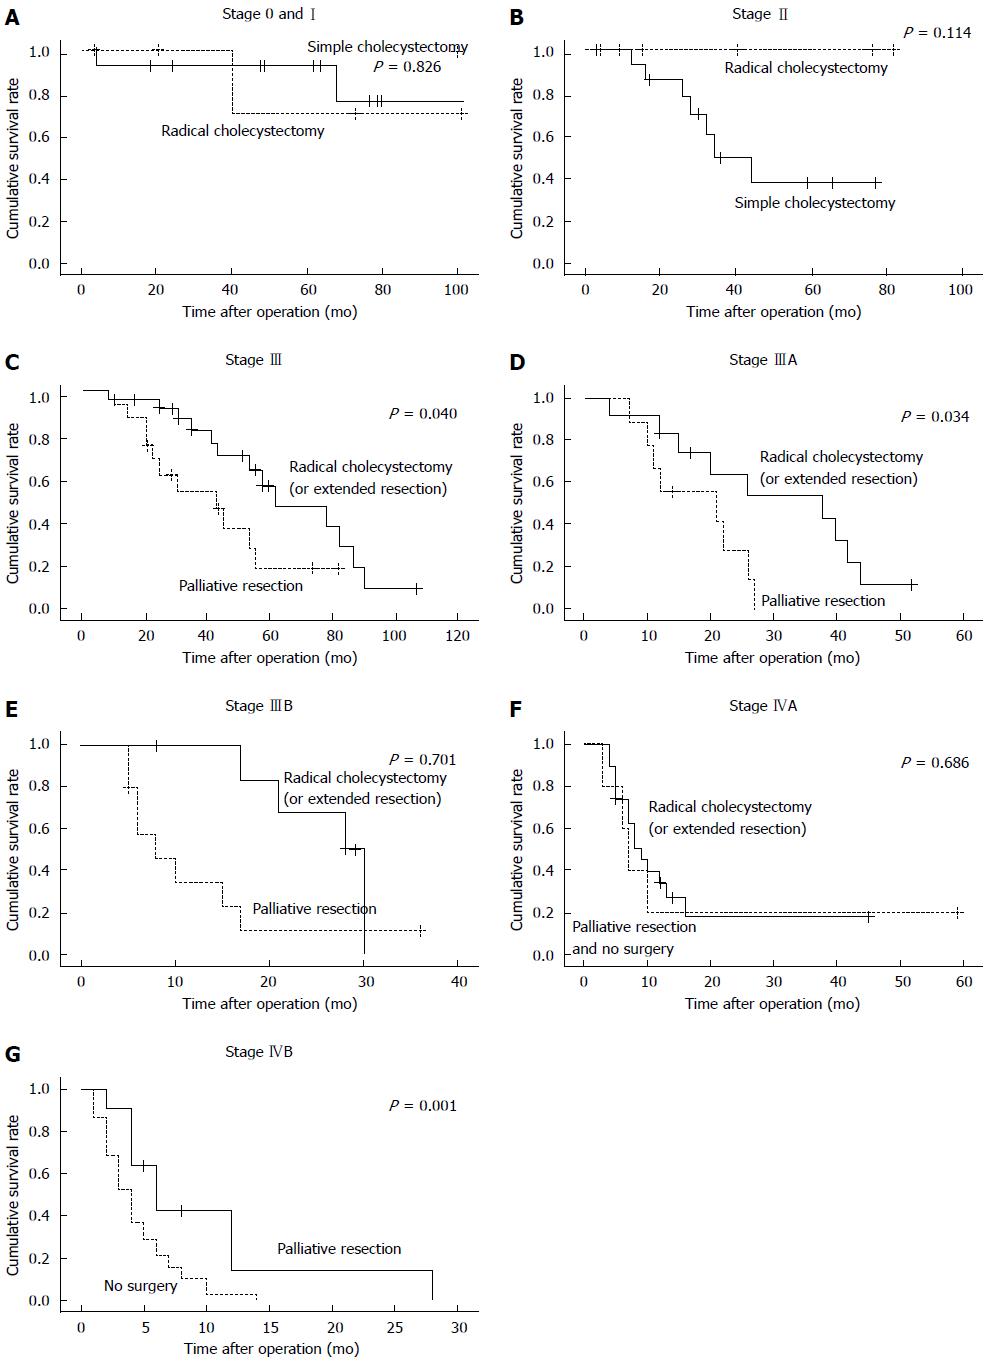
Figure 1 Kaplan-Meir curves for patient survival rate in correlation with surgical procedures.
Patients underwent one of the surgical procedures as indicated in the figure, and survival curves were analyzed and compared within each TNM staging group. A: Stages 0 and I; B: Stage II; C: Stage III; D: Stage IIIA; E: Stage IIIB; F: Stage IVA; G: Stage IVB.
- Citation: He XD, Li JJ, Liu W, Qu Q, Hong T, Xu XQ, Li BL, Wang Y, Zhao HT. Surgical procedure determination based on tumor-node-metastasis staging of gallbladder cancer. World J Gastroenterol 2015; 21(15): 4620-4626
- URL: https://www.wjgnet.com/1007-9327/full/v21/i15/4620.htm
- DOI: https://dx.doi.org/10.3748/wjg.v21.i15.4620


