Copyright
©The Author(s) 2015.
World J Gastroenterol. Mar 28, 2015; 21(12): 3706-3710
Published online Mar 28, 2015. doi: 10.3748/wjg.v21.i12.3706
Published online Mar 28, 2015. doi: 10.3748/wjg.v21.i12.3706
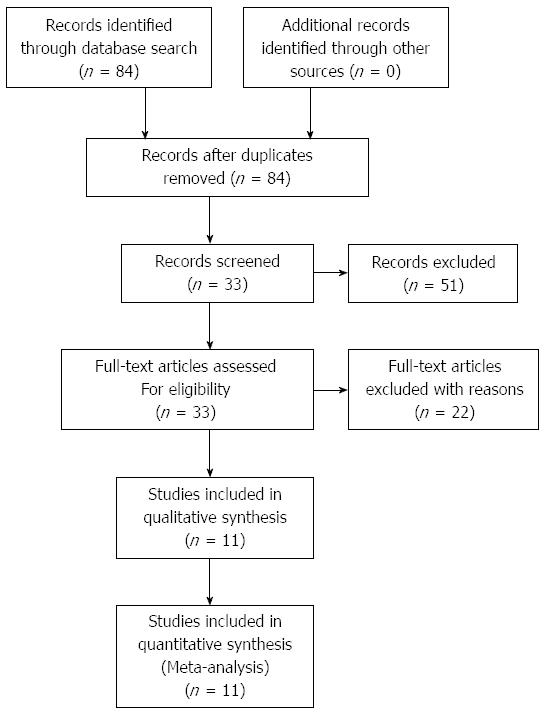
Figure 1 Flow chart of the meta-analysis.
Figure 2 Fixed-effects model of hazard ratio of overall survival associated with c-Met overexpression.
Figure 3 Fixed-effects model of hazard ratio of progression-free survival associated with c-Met overexpression.
Figure 4 Forest plot showing the meta-analysis of hazard ratio reported for overall survival in patients.
- Citation: Liu Y, Yu XF, Zou J, Luo ZH. Prognostic value of c-Met in colorectal cancer: A meta-analysis. World J Gastroenterol 2015; 21(12): 3706-3710
- URL: https://www.wjgnet.com/1007-9327/full/v21/i12/3706.htm
- DOI: https://dx.doi.org/10.3748/wjg.v21.i12.3706


