Copyright
©The Author(s) 2015.
World J Gastroenterol. Mar 28, 2015; 21(12): 3527-3536
Published online Mar 28, 2015. doi: 10.3748/wjg.v21.i12.3527
Published online Mar 28, 2015. doi: 10.3748/wjg.v21.i12.3527
Figure 1 Hepatitis B surface antigen, hepatitis B e antigen and hepatitis B virus DNA levels in serum of C3H/HeN and C57BL/6 mice after hydrodynamic injection.
pAAV/HBV1.2 DNA was injected hydrodynamically into the tail vein of 5-6 wk male C3H/HeN and C57BL/6 mice. After injection, the mice were regularly bled to monitor the serum levels of HBsAg, HBeAg and HBV DNA. A: Titer of serum HBsAg in C3H/HeN or C57BL/6 mice after HI at different time points; B: Positive rates of serum HBsAg in C3H/HeN (n = 25) or C57BL/6 (n = 20) mice at different time points after HI; C: Titer of serum HBeAg in C3H/HeN or C57BL/6 mice after HI at different time points; D: Serum HBV DNA level was determined at different time points. HBsAg: Hepatitis B surface antigen; HBeAg: Hepatitis B e antigen; HBV: Hepatitis B virus; HI: Hydrodynamic injection.
Figure 2 Quantification of intrahepatic hepatitis B virus DNA in the hydrodynamically injected mice.
C3H/HeN or C57BL/6 mice were hydrodynamically injected with 10 μg of pAAV/HBV1.2 plasmid, and the livers of hydrodynamically injected C3H/HeN (n = 3) or hydrodynamically injected C57BL/6 (n = 3) mice were collected at 8 wk or 46 wk after HI. Naive C3H/HeN (n = 3) or C57BL/6 (n = 3) mice were controls (ctrl). A: HBV DNA/mGAPDH in C3H/HeN or C57BL/6 mouse liver total DNA with or without 0.5 μL DpnI digestion at 8 wk post HI; B: HBV DNA/mGAPDH in C3H/HeN or C57BL/6 mouse liver total DNA with or without 0.5 μL DpnI digestion at 46 wk post HI. HBV: Hepatitis B virus; HI: Hydrodynamic injection.
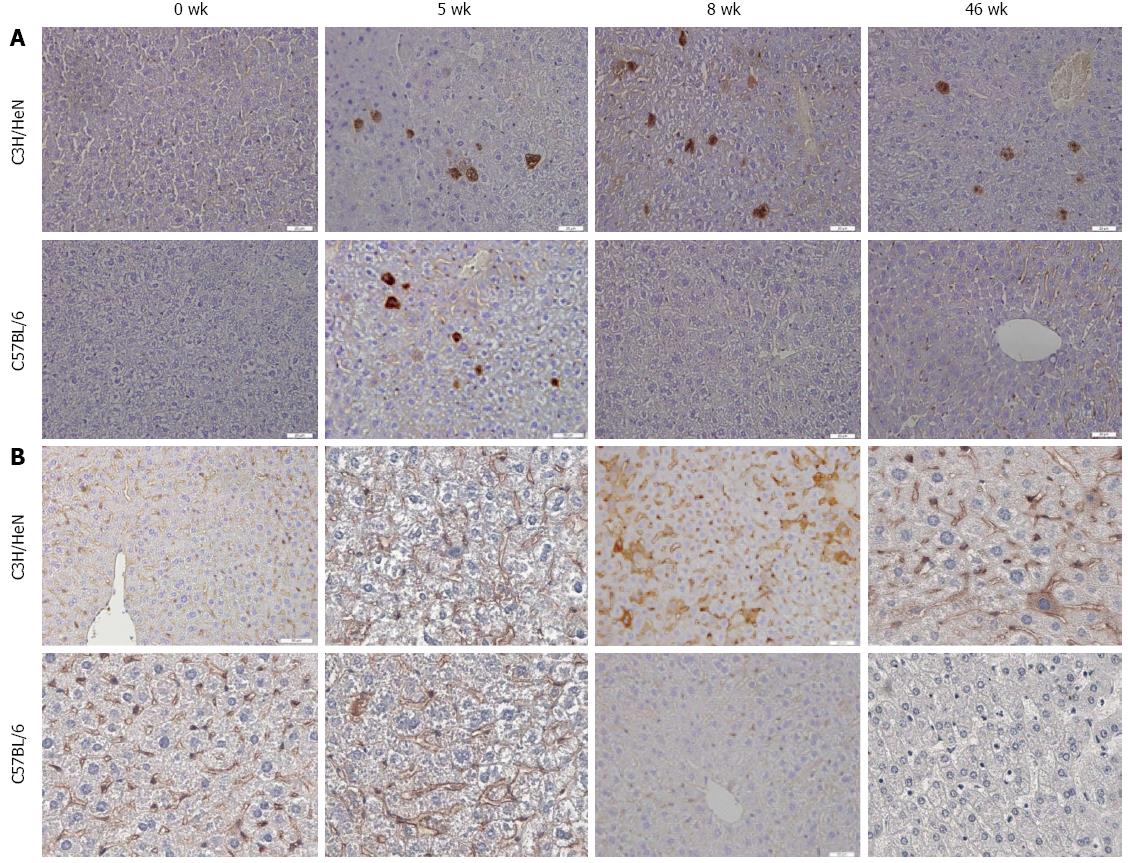
Figure 3 Longer expression of hepatitis B core antigen and hepatitis B surface antigen in the liver of C3H/HeN mice than C57BL/6 mice.
C3H/HeN or C57BL/6 mice were hydrodynamically injected with 10 μg of pAAV/HBV1.2 plasmid, and the livers of C3H/HeN or C57BL/6 mice were collected at 5, 8 and 46 wk after HI. A: Detection of HBcAg expression in C3H/HeN or C57BL/6 mouse liver at 5, 8 and 46 wk after HI by immunochemistry; B: Detection of HBsAg expression in C3H/HeN or C57BL/6 mouse liver at 5, 8 and 46 wk after HI by chemistry. Images of specific antibody stained slides were observed under a microscope at magnification of x 400. Experiments were repeated twice with a similar pattern. HBcAg: Hepatitis B core antigen; HBsAg: Hepatitis B surface antigen; HI: Hydrodynamic injection.
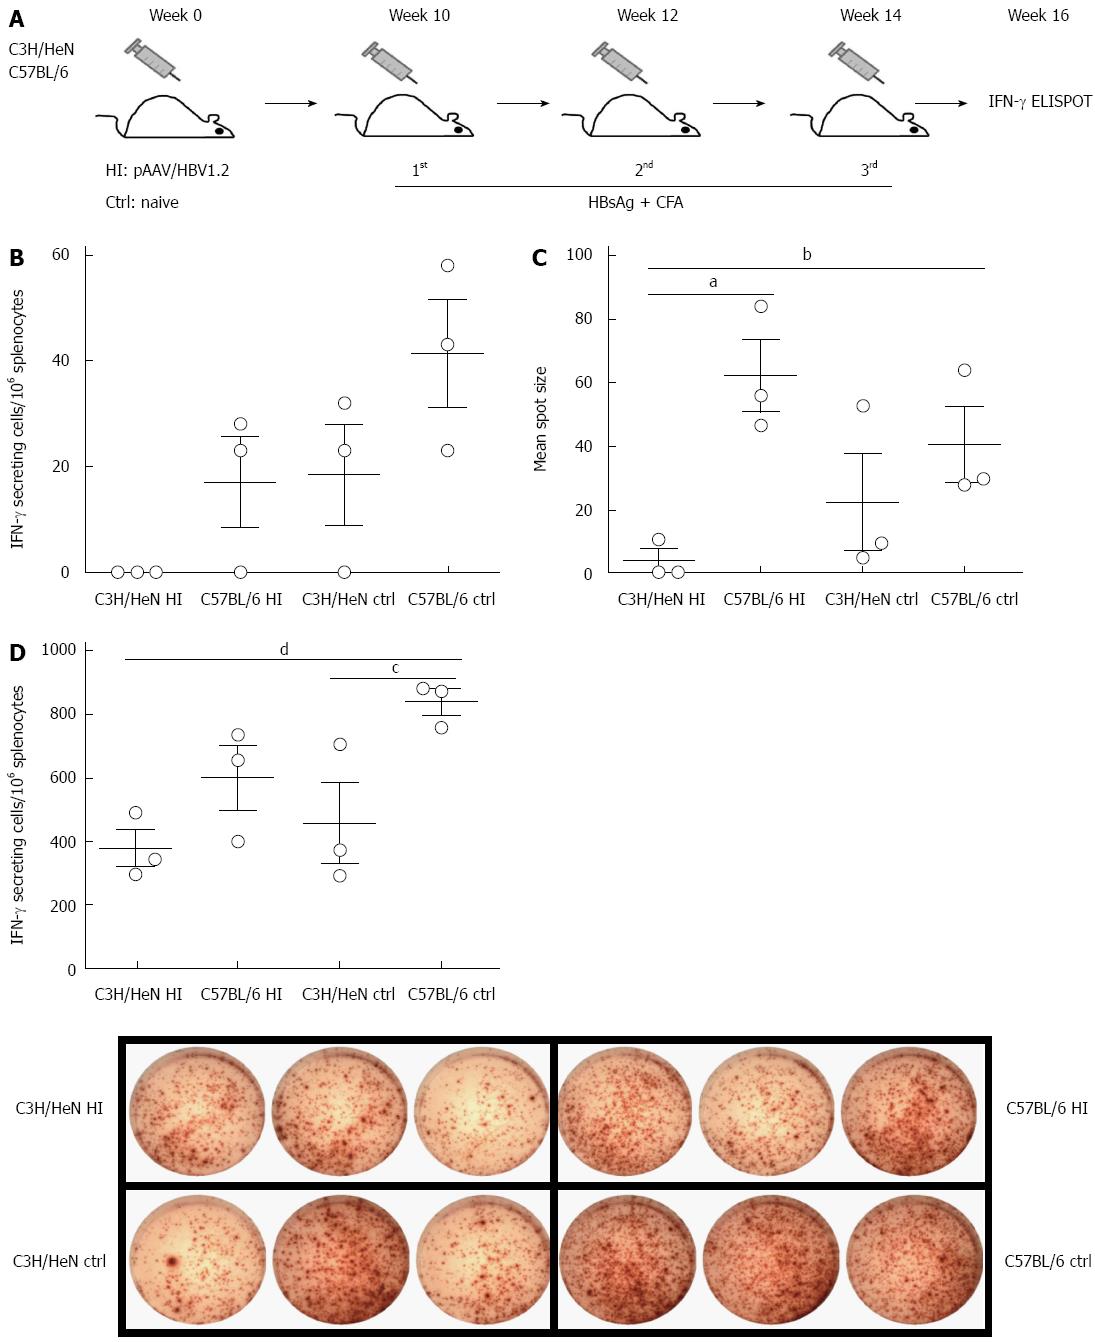
Figure 4 Hepatitis B surface antigen-specific T cell responses are impaired in hydrodynamically injected C3H/HeN mice.
A: Regime of immunization: hydrodynamically injected C3H/HeN mice (n = 3) and C57BL/6 mice (n = 3) were subcutaneously injected with 5 μg HBsAg protein formulated in CFA at 10, 12, and 14 wk after HI. Age-matched C3H/HeN naïve mice (n = 3) and C57BL/6 naïve mice (n = 3) were subcutaneously injected with 5 μg HBsAg protein formulated in CFA three times at a 2-wk interval. Magnitudes of the total T cell responses were analyzed by IFN-γ ELISPOT two weeks after the final vaccination; B: Frequencies of IFN-γ producing T cells in C3H/HeN and C57BL/6 mice (both hydrodynamically injected ones and controls, n = 3 each group) after HBsAg stimulation. While hydrodynamically injected C3H/HeN mice showed almost zero in the frequency of IFN-γ positive cells, the other groups did show IFN-γ positive cells; C: Spot sizes of IFN-γ producing T cells in C3H/HeN and C57BL/6 mice (both hydrodynamically injected ones and controls, n = 3 each group) after HBsAg stimulation. Hydrodynamically injected C57BL/6 and control (ctrl) mice were significantly larger than hydrodynamically injected C3H/HeN mice [aP < 0.05, C57BL/6 HI vs C3H/HeN HI mice; bP < 0.01 control (ctrl) mice vs C3H/HeN HI mice, respectively]; D: IFN-γ producing T cell spot in C3H/HeN and C57BL/6 mice (both hydrodynamically injected ones and controls, n = 3 each group) after PMA + ionomysin stimulation; left: bar chart of frequencies of IFN-γ producing T cells. Hydrodynamically injected C57BL/6 mice were significantly higher than hydrodynamically injected C3H/HeN mice (dP < 0.01, C57BL/6 HI vs C3H/HeN HI mice), and C3H/HeN mice (cP < 0.05, C57BL/6 HI vs C3H/HeN); right: Images of ELISOPT. HI: Hydrodynamic injection; CFA: Complete Freund’s adjuvant; IFN: Interferon; HBsAg: Hepatitis B surface antigen.
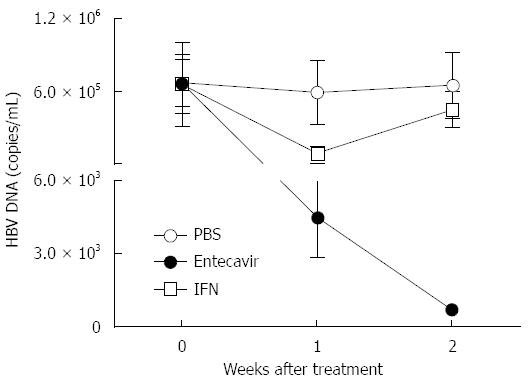
Figure 5 Interferon-α or entecavir treatment decreases hepatitis B virus DNA in hydrodynamically injected C3H/HeN mice.
HI mouse model of HBV was created in 5-6-wk-old male C3H/HeN mice. IFN-α, entecavir or PBS treatment was performed on those mice 5 wk post HI. The black dot group (n = 5) was intragastrically administrated with 0.1 mg/kg entecavir once a day for 14 d; the open square group (n = 5) was intraperitoneally injected with 1 mg/kg IFN-α twice a week for 2 wk; the open dot group was treated with PBS as a control. Serum specimens were collected and assayed for HBV DNA on days 0, 7 and 14 after treatment. HBV: Hepatitis B virus; HI: Hydrodynamic injection; IFN: Interferon.
- Citation: Peng XH, Ren XN, Chen LX, Shi BS, Xu CH, Fang Z, Liu X, Chen JL, Zhang XN, Hu YW, Zhou XH. High persistence rate of hepatitis B virus in a hydrodynamic injection-based transfection model in C3H/HeN mice. World J Gastroenterol 2015; 21(12): 3527-3536
- URL: https://www.wjgnet.com/1007-9327/full/v21/i12/3527.htm
- DOI: https://dx.doi.org/10.3748/wjg.v21.i12.3527


