Copyright
©The Author(s) 2015.
World J Gastroenterol. Mar 28, 2015; 21(12): 3519-3526
Published online Mar 28, 2015. doi: 10.3748/wjg.v21.i12.3519
Published online Mar 28, 2015. doi: 10.3748/wjg.v21.i12.3519
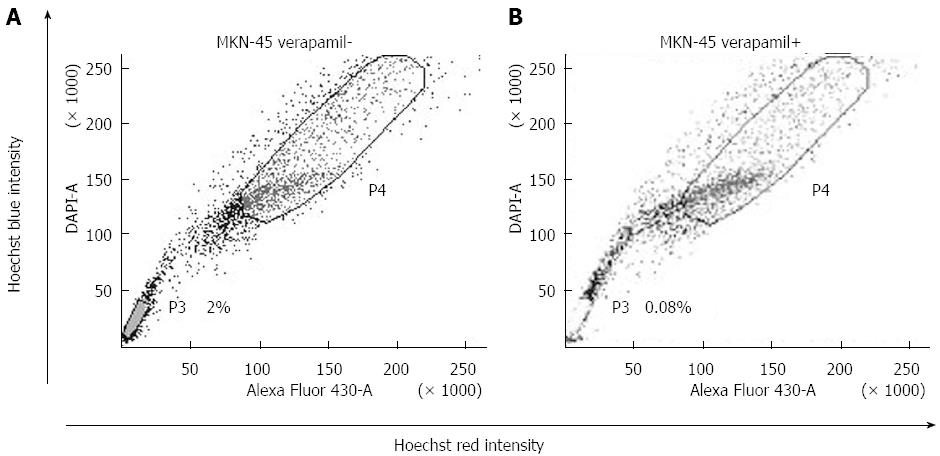
Figure 1 Side population cell analysis.
The P3 gate was the side population (SP) cells and the P4 gate was the major population (MP) cells. A: SP ratio in MKN-45 was 2.0%; B: The SP cells obviously decreased with both Hoechst 33342 and verapamil. Figure 1 cited partly from the article of Not All Side Population Cells Contain Cancer Stem-Like Cells in Human Gastric Cancer Cell Lines which published in Dig Dis Sci 2013; 58: 132-139.
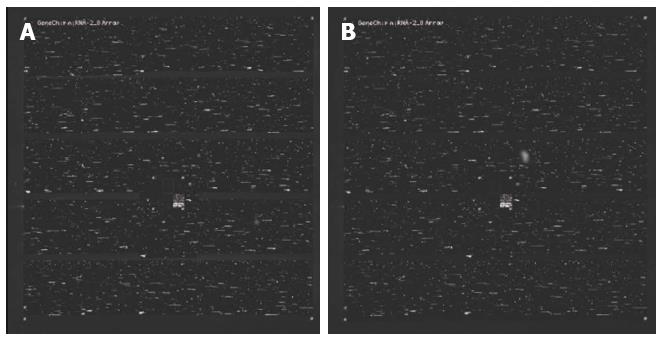
Figure 2 MicroRNA microarray.
Affymetrix genechip 2.0 was used to examine microRNA expression profiles of SP and MP cells of MKN-45. A: Hybridized genechip with microRNA of SP cells; B: Hybridized genechip with microRNA of MP cells. SP: Side population; MP: Major population.
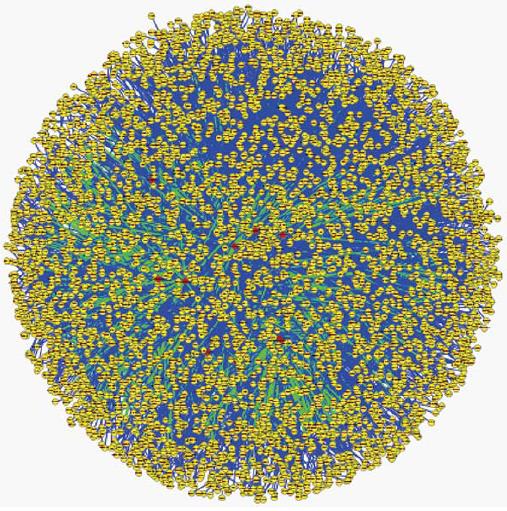
Figure 3 Visualization of the global microRNA regulated network.
Red nodes represent microRNA, yellow nodes represent coding genes. Green edge represents the microRNA-target relationship, blue edge represents the protein-protein interaction.
- Citation: Zhang HH, Gu GL, Zhang XY, Li FZ, Ding L, Fan Q, Wu R, Shi W, Wang XY, Chen L, Wei XM, Yuan XY. Primary analysis and screening of microRNAs in gastric cancer side population cells. World J Gastroenterol 2015; 21(12): 3519-3526
- URL: https://www.wjgnet.com/1007-9327/full/v21/i12/3519.htm
- DOI: https://dx.doi.org/10.3748/wjg.v21.i12.3519


