Copyright
©The Author(s) 2015.
World J Gastroenterol. Mar 21, 2015; 21(11): 3351-3360
Published online Mar 21, 2015. doi: 10.3748/wjg.v21.i11.3351
Published online Mar 21, 2015. doi: 10.3748/wjg.v21.i11.3351
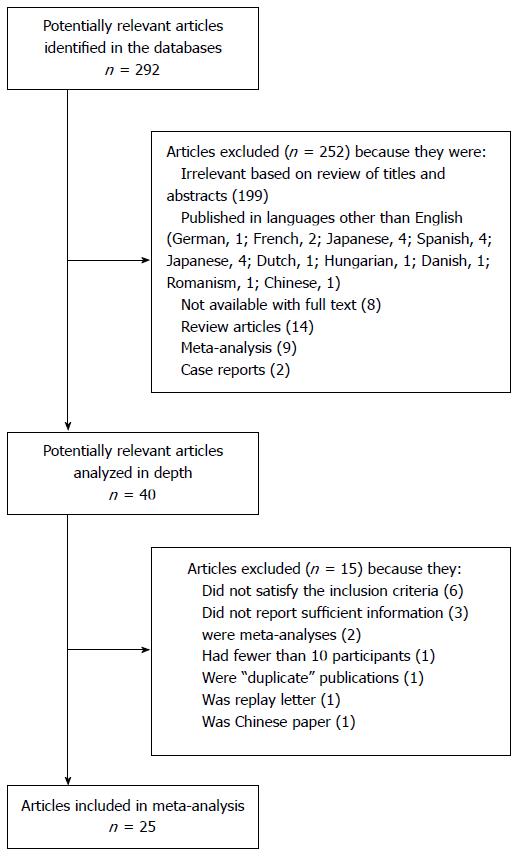
Figure 1 Flow chart of study selection.
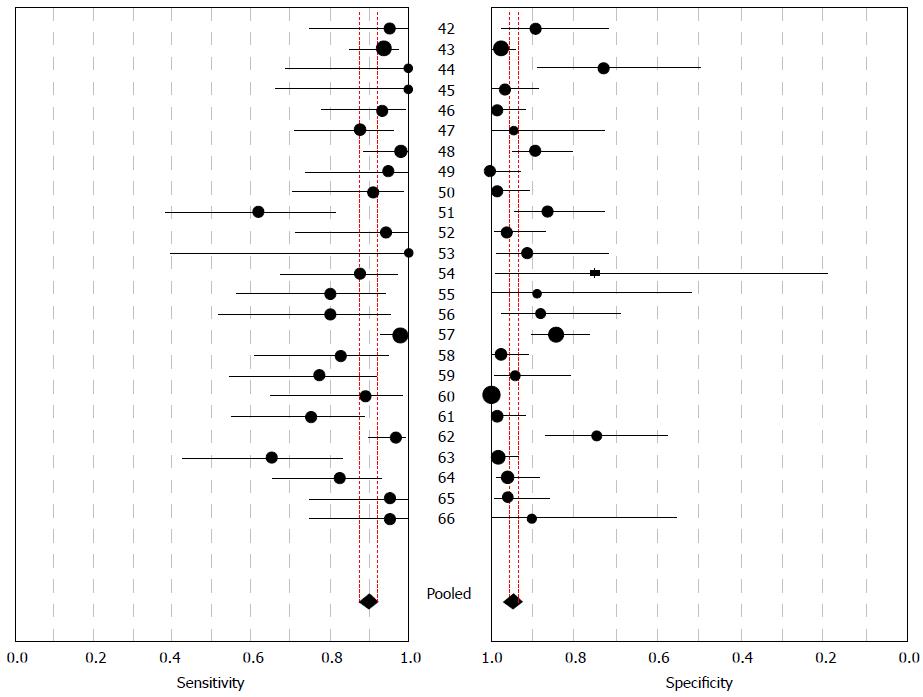
Figure 2 Forest plot showing sensitivity and specificity of magnetic resonance cholangiopancreatography in the diagnosis of choledocholithiasis.
The point estimates of sensitivity and specificity from each study are shown as solid circles. Horizontal error bars indicate 95%CIs. Numbers between the plots refer to references. Pooled estimates for the magnetic resonance cholangiopancreatography detections were 0.90 for sensitivity (95%CI: 0.88-0.92) and 0.95 for specificity (95%CI: 0.93-1.0).
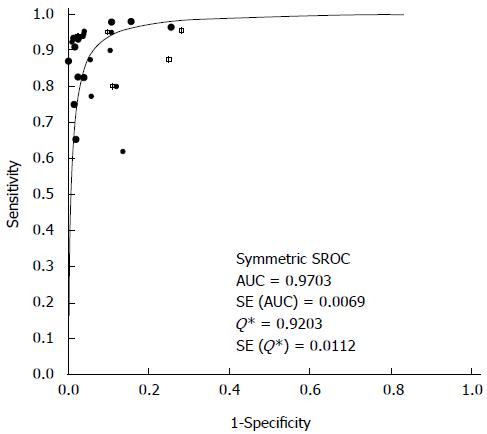
Figure 3 Summary receiver operating characteristic curves for magnetic resonance cholangiopancreatography detection.
Solid circles represent each study included in the meta-analysis. The size of each study is indicated by the size of the solid circle. Summary receiver operating characteristic (SROC) curves summarize the overall diagnostic accuracy; AUC: Area under the curve.
- Citation: Chen W, Mo JJ, Lin L, Li CQ, Zhang JF. Diagnostic value of magnetic resonance cholangiopancreatography in choledocholithiasis. World J Gastroenterol 2015; 21(11): 3351-3360
- URL: https://www.wjgnet.com/1007-9327/full/v21/i11/3351.htm
- DOI: https://dx.doi.org/10.3748/wjg.v21.i11.3351


