Copyright
©2014 Baishideng Publishing Group Co.
World J Gastroenterol. Feb 21, 2014; 20(7): 1797-1806
Published online Feb 21, 2014. doi: 10.3748/wjg.v20.i7.1797
Published online Feb 21, 2014. doi: 10.3748/wjg.v20.i7.1797
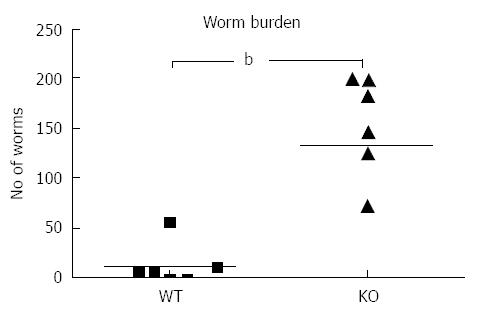
Figure 1 Mdr1a-/- (KO) mice show increased susceptibility to Trichuris muris infection compared to FVB controls (WT).
Data shows large intestinal worm burden measured on day 19 following infection with approximately 200 embryonated Trichuris muris eggs. Each data point represents a single mouse (n = 6 in each group); the horizontal bar denotes the mean for each group. bP < 0.01.
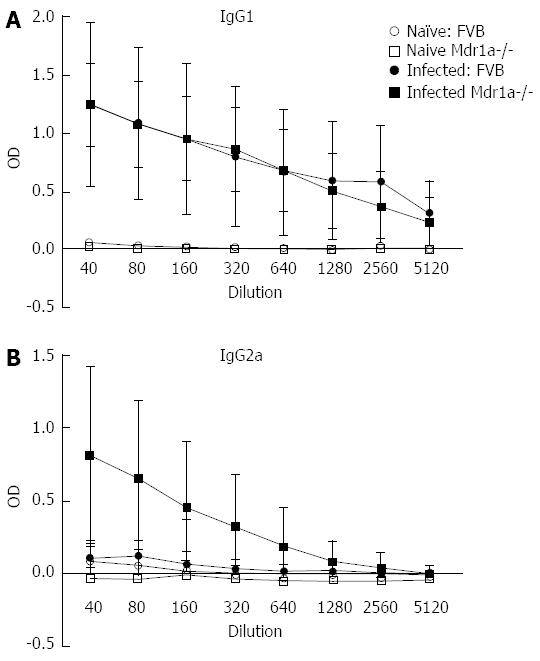
Figure 2 Parasite-specific IgG1 and IgG2a antibody responses in the serum of naïve and Trichuris muris infected FVB (WT) and mdr1a-/- (KO) mice.
Serum was taken from mice at day 19 post infection. Data shows mean ± SD for n = 5-7 animals in each group. OD: Optical density.
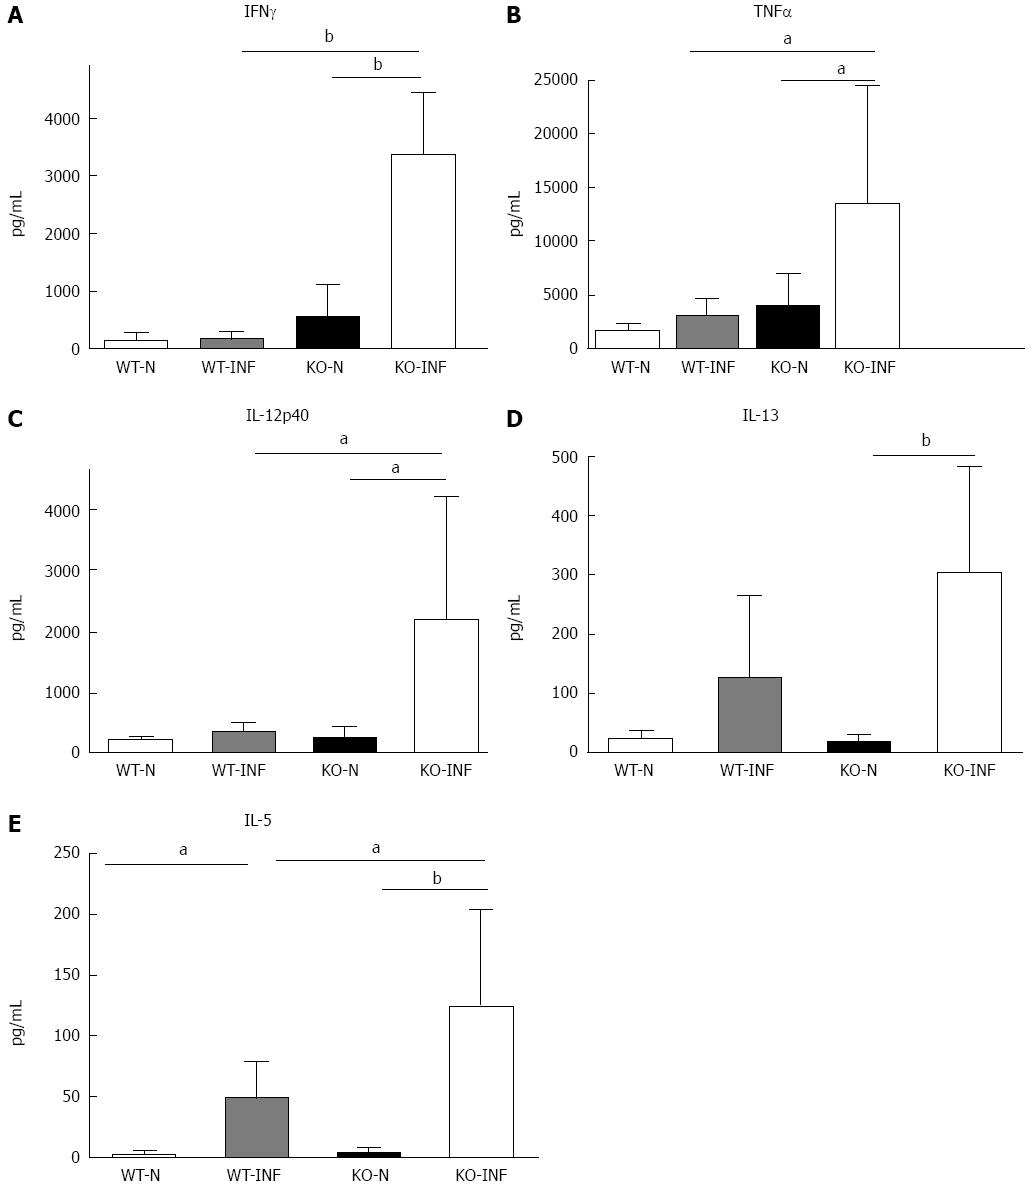
Figure 3 Cytokine production by mesenteric lymph nodes from naïve and Trichuris muris infected FVB (WT) and mdr1a-/- (PGP-KO) mice.
Levels of Th1 [interferon (IFN)γ, A; interleukin (IL)-12p40, C] and Th2 (IL-13, D; IL-5, E) and the pro-inflammatory cytokine [tumor necrosis factor (TNF)α, B] were measured in mesenteric lymph nodes (MLN) following in vitro stimulation with Trichuris muris (T. muris) E/S antigen. MLN were isolated on day 19 post infection in T. muris infected groups. Data is shown as mean + SD for n = 5 animals in each group aP < 0.05; bP < 0.01.
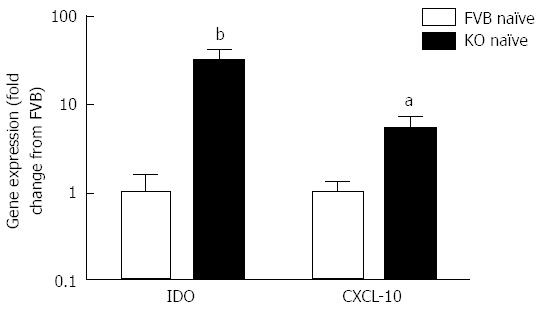
Figure 4 Expression of interferon γ-dependent genes IDO and CXCL-10 in colonocytes from naïve Mdr1a-/- and FVB mice.
mRNA expression was measured relative to β-actin in each case. Data is expressed as fold change in expression in Mdr1a-/- colonocytes relative to FVB controls and is shown as mean ± SD for n = 4 preparations for each group. aP < 0.05, bP < 0.01 vs FVB groups.
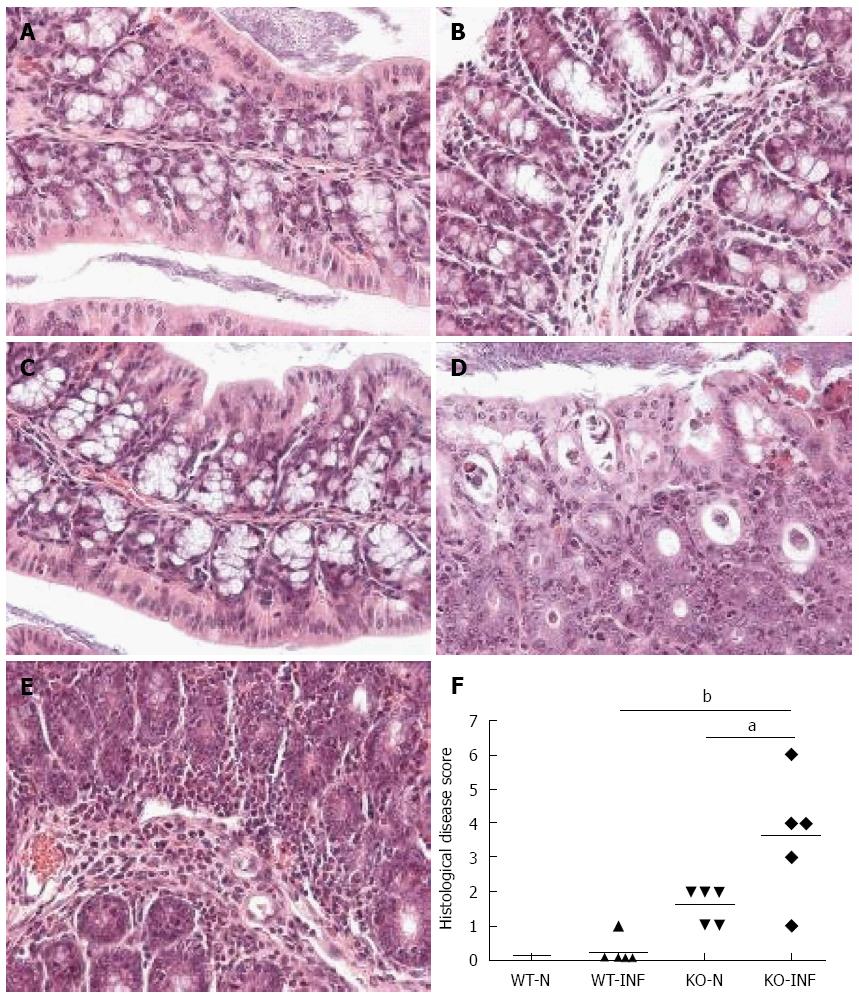
Figure 5 Histological analysis of proximal colon from FVB (WT) and mdr1a-/- (PGP-KO) mice.
A-E: H and E stained sections from proximal colon of WT-N (A), WT-INF (B), KO-N (C) and KO-INF (D-E). Tissues were isolated on day 19 post-infection in Trichuris muris (T. muris) infected mice; F: Histological disease scores for colon from naïve (WT-N; KO-N) and T. muris infected (WT-INF; KO-INF) mice based on the grading system described by Collett et al[11], 2008. Bar shows mean values for each group aP < 0.05, bP < 0.01, n = 5 for each group.
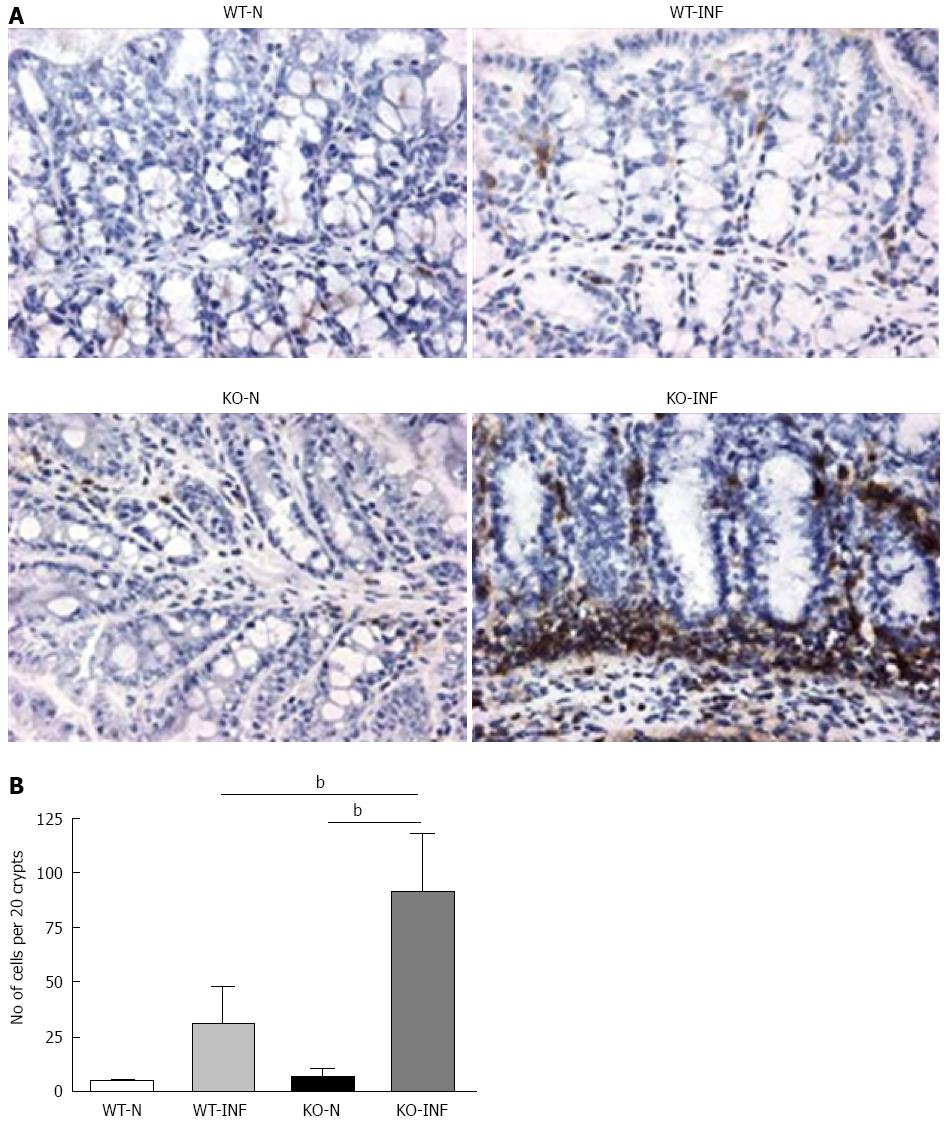
Figure 6 CD4+ T-cell infiltration associated with Trichuris muris infection in the proximal colon of FVB (WT) and mdr1a-/- (PGP-KO) mice.
A: Immunohistochemical staining for CD4+ T cells in naïve (WT-N; KO-N) and Trichuris muris (T. muris) infected (WT-INF; KO-INF) WT and PGP-KO mice; B: Mean data (± SD) from 5 animals in each group showing CD4+ T cells present per 20 crypts units. Tissues were isolated on day 19 post-infection in T. muris infected mice, bP < 0.01.
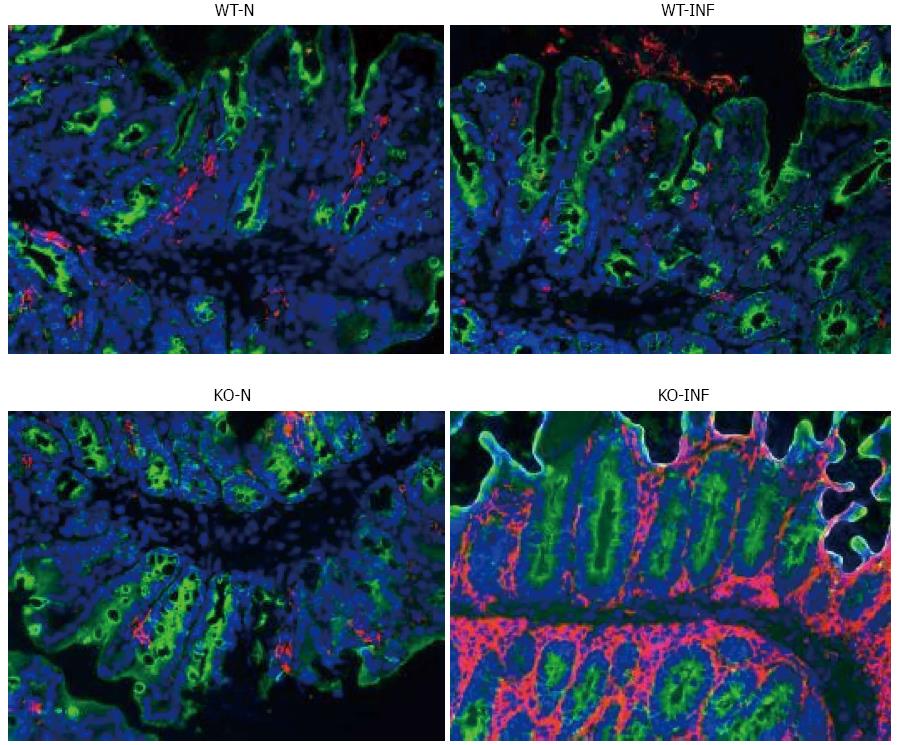
Figure 7 Dendritic cell infiltration associated with Trichuris muris infection in the proximal colon of FVB (WT) and mdr1a-/- (PGP-KO) mice.
Fluorescence staining (pink) for dendritic cells in frozen sections of proximal colon from naïve (WT-N; KO-N) and Trichuris muris (T. muris) infected (WT-INF; KO-INF) mice. Tissues were removed on day 19 post infection in T. muris infected mice. Original magnification × 20. Images are representative of tissues from 5 mice in each group.
-
Citation: Bhardwaj EK, Else KJ, Rogan MT, Warhurst G. Increased susceptibility to
Trichuris muris infection and exacerbation of colitis in Mdr1a-/- mice. World J Gastroenterol 2014; 20(7): 1797-1806 - URL: https://www.wjgnet.com/1007-9327/full/v20/i7/1797.htm
- DOI: https://dx.doi.org/10.3748/wjg.v20.i7.1797


