Copyright
©2014 Baishideng Publishing Group Co.
World J Gastroenterol. Feb 7, 2014; 20(5): 1332-1339
Published online Feb 7, 2014. doi: 10.3748/wjg.v20.i5.1332
Published online Feb 7, 2014. doi: 10.3748/wjg.v20.i5.1332
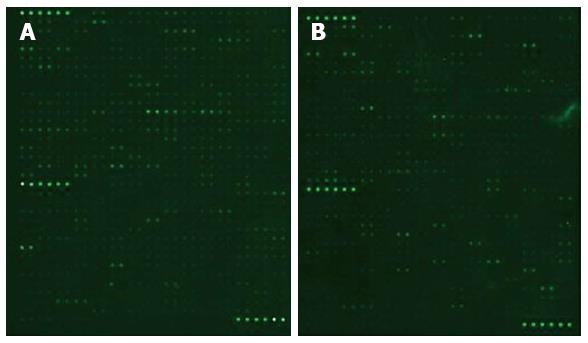
Figure 1 Example images of protein biochip scans of colorectal cancer and healthy control samples.
A: Normal control group; B: Colorectal cancer group.
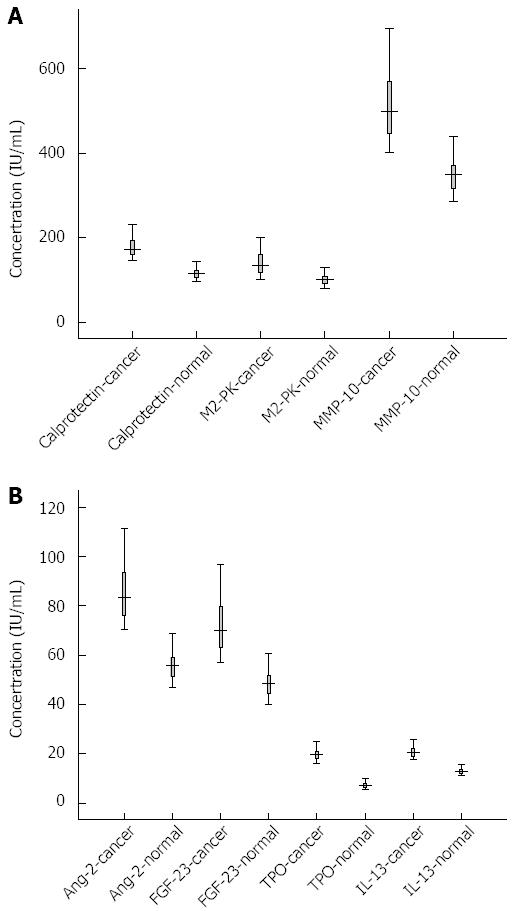
Figure 2 Median and interquartile range of proteins concentrations among colorectal cancer patients and healthy controls.
A: Calprotectin, M2-pyruvatekinase (M2-PK), proteins of the matrix metalloproteinase (MMP-10); B: Angiopoietin-2 (Ang-2), fibroblast growth factor-23 (FGF-23), thrombopoietin (TPO) and interleukin-13 (IL-13).
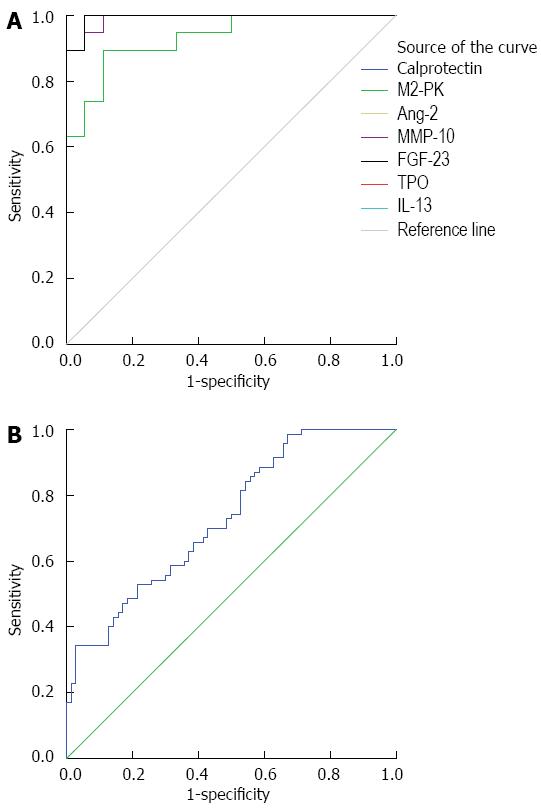
Figure 3 Receiver operating curve for the seven fecal protein.
A: Receiver operating curve (ROC) for the seven fecal protein in detecting patients with colorectal cancer (CRC, n = 19) and healthy controls (n = 18). Calprotectin, angiopoietin-2 (Ang-2), thrombopoietin (TPO), interleukin-13 (IL-13): area under the curve (AUC) = 1; M2-pyruvatekinase (M2-PK): AUC = 0.933; matrix metalloproteinase (MMP-10): AUC = 0.991; fibroblast growth factor-23 (FGF-23): AUC = 0.994; B: ROC for the seven fecal protein combined in detecting patients with CRC (n = 10) and healthy controls (n = 10). Sensitivity= 0.7, specificity = 0.4. AUC = 0.729.
- Citation: Wang HP, Wang YY, Pan J, Cen R, Cai YK. Evaluation of specific fecal protein biochips for the diagnosis of colorectal cancer. World J Gastroenterol 2014; 20(5): 1332-1339
- URL: https://www.wjgnet.com/1007-9327/full/v20/i5/1332.htm
- DOI: https://dx.doi.org/10.3748/wjg.v20.i5.1332


