Copyright
©2014 Baishideng Publishing Group Inc.
World J Gastroenterol. Nov 28, 2014; 20(44): 16690-16697
Published online Nov 28, 2014. doi: 10.3748/wjg.v20.i44.16690
Published online Nov 28, 2014. doi: 10.3748/wjg.v20.i44.16690
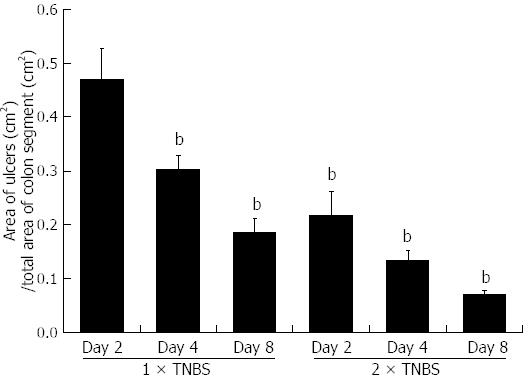
Figure 1 Means of the ulcerated area per total area of colonic segments in rat descending colon two (n = 8), four (n = 9) and eight (n = 10) days after the first and second TNBS treatments.
The extension of the ulcerated area was reduced significantly after the second dose of TNBS compared to that in the animals treated only once. Data are expressed as mean ± SE. bP < 0.01 vs once TNBS-treated group on day two. TNBS: 2,4,6-trinitrobenzenesulfonic acid.
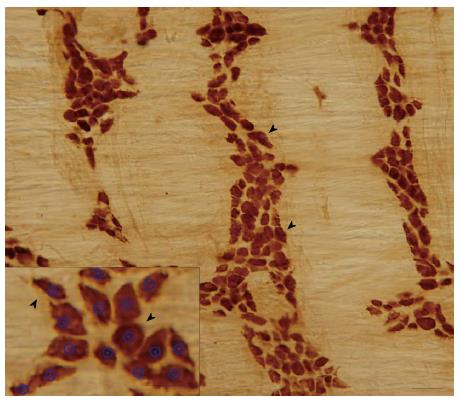
Figure 2 Representative light micrographs of whole mount preparations of the rat descending colon after HuC/HuD immunohistochemistry.
Arrowheads point to stained myenteric neurons. Density of neurons per field was determined with Plexus Pattern Analysis software, where the soma of the neurons was encircled (insert). Bars: 50 μm and 25 μm (insert).
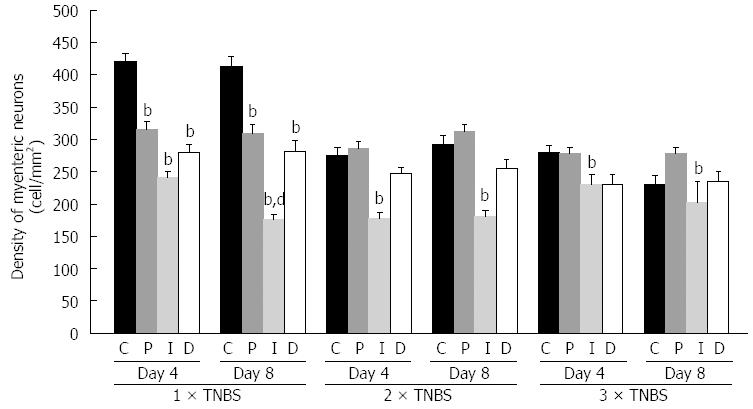
Figure 3 Density of HuC/HuD-immunoreactive myenteric neurons in the colonic segments of control (C) (n = 12) and TNBS-treated rats four (n = 13) and eight (n = 14) days after colitis induction.
In the TNBS-treated groups the inflamed segment (I) and the adjacent proximal (P) and distal (D) colonic segments were examined. Significant decrease in myenteric neuronal density was first detected on day four after each TNBS administration. When the rats were treated only once (1 × TNBS) the number of myenteric neurons decreased significantly in all three colonic segments, while after repeated treatments (2 × TNBS, 3 × TNBS), a significant decrease in neuronal number was demonstrated exclusively in the I segments. After the single dose of TNBS a further significant neuronal loss was detected until day eight post-induction, whereas after repeated treatments the number of myenteric neurons did not decrease further between days four and eight. Data are expressed as means ± SE. bP < 0.01 vs age-matched control groups; dP < 0.01 vs once TNBS-treated group on day four. TNBS: 2,4,6-trinitrobenzenesulfonic acid.
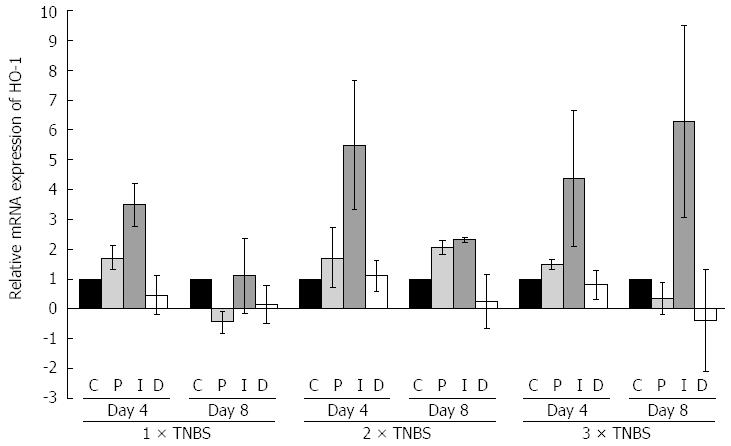
Figure 4 Relative mRNA expression of heme oxygenase-1 compared to the controls (n = 12) (C) in the inflamed segment (I) and the adjacent proximal (P) and distal (D) colonic segments four (n = 13) and eight (n = 14) days after TNBS treatments.
Irrespectively of the number of treatments (1 × TNBS, 2 × TNBS, 3 × TNBS), the HO-1 expression was always marked on day four in the I segments and a more limited expression was also detected in the P but not in the D colonic segments. After the first and second TNBS administrations the rate of HO-1 gene expression decreased, but never returned to baseline level up to day eight post-induction. Nevertheless, after the third TNBS treatment the high level of HO-1 expression was not merely sustained: a pronounced further increase was demonstrated until day eight post-induction. Data are expressed as means ± SD. TNBS: 2,4,6-trinitrobenzenesulfonic acid; HO-1: Heme oxygenase-1.
Figure 5 Protein expression of heme oxygenase-1 (32 kDa) in the inflamed segments of the colon four (n = 4) and eight (n = 5) days after TNBS treatments, compared to the controls (n = 4) (C).
Four days after the first and second treatment (1 × TNBS, 2 × TNBS) elevated heme oxygenase-1 (HO-1) protein level was detected. Than the amounts of protein in both samples declined and eight days after the first treatment it reached already the baseline level. Following the third treatment (3 × TNBS) HO-1 protein expression could not be detected at all. TNBS: 2,4,6-trinitrobenzenesulfonic acid; HO-1: Heme oxygenase-1.
- Citation: Talapka P, Nagy LI, Pál A, Poles MZ, Berkó A, Bagyánszki M, Puskás LG, Fekete &, Bódi N. Alleviated mucosal and neuronal damage in a rat model of Crohn’s disease. World J Gastroenterol 2014; 20(44): 16690-16697
- URL: https://www.wjgnet.com/1007-9327/full/v20/i44/16690.htm
- DOI: https://dx.doi.org/10.3748/wjg.v20.i44.16690


