Copyright
©2014 Baishideng Publishing Group Inc.
World J Gastroenterol. Nov 14, 2014; 20(42): 15852-15859
Published online Nov 14, 2014. doi: 10.3748/wjg.v20.i42.15852
Published online Nov 14, 2014. doi: 10.3748/wjg.v20.i42.15852
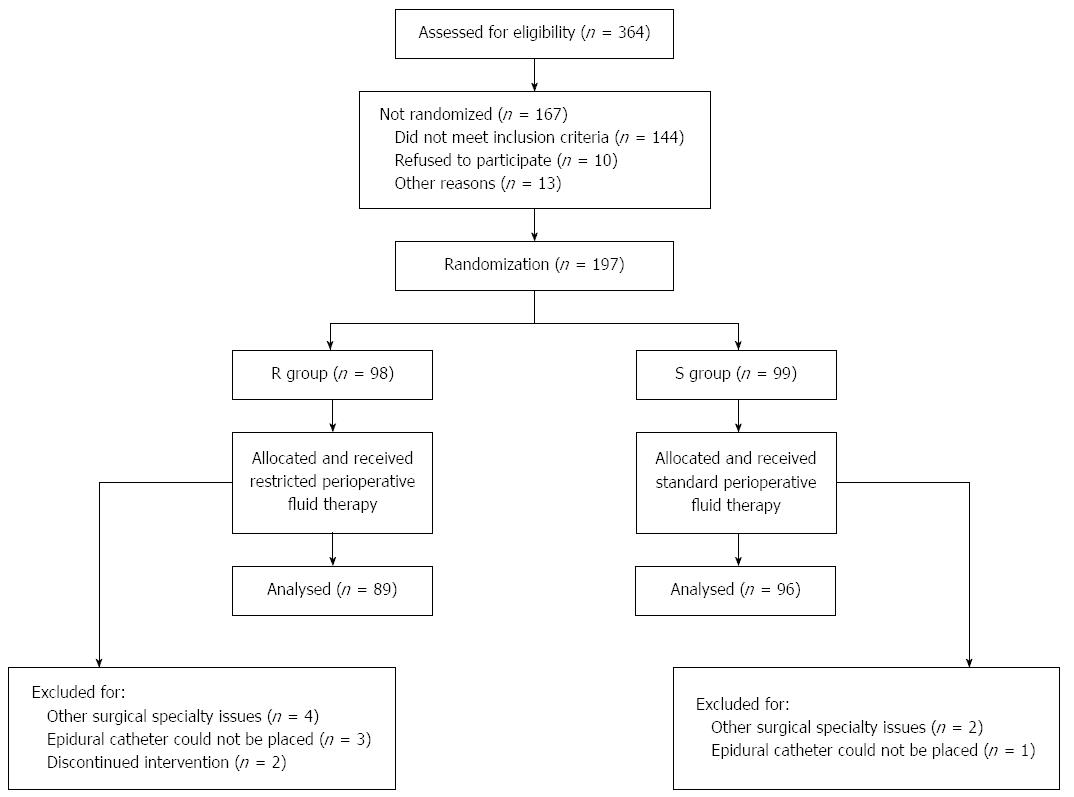
Figure 1 CONSORT diagram for the trial.
R group: Restricted fluid therapy group; S group: Standard fluid therapy group.
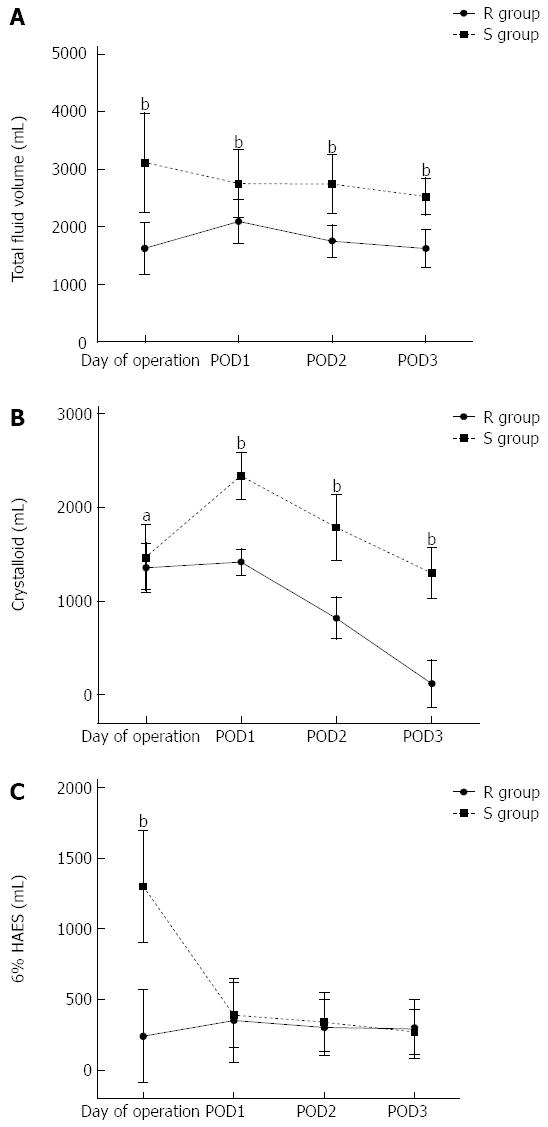
Figure 2 Evolution of intravenous fluids received by the patients in two groups.
Data are mean ± SD. POD: Postoperative day; HAES: Hydroxyethyl starch; R group: Restricted fluid therapy group; S group: Standard fluid therapy group. aP < 0.05, bP < 0.01 R group vs S group.
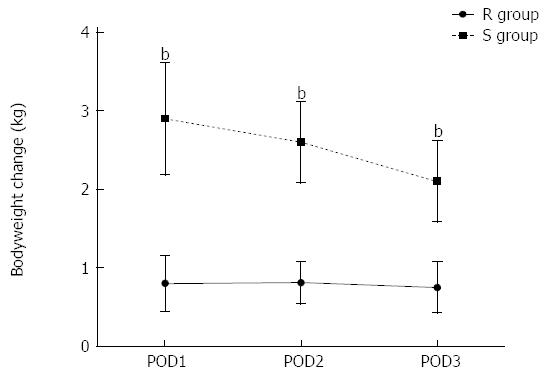
Figure 3 Body weight changes in the first 3 d after surgery in two groups.
Data are mean ± SD. POD: Postoperative day; R group: Restricted fluid therapy group; S group: Standard fluid therapy group. bP < 0.01 R group vs S group.
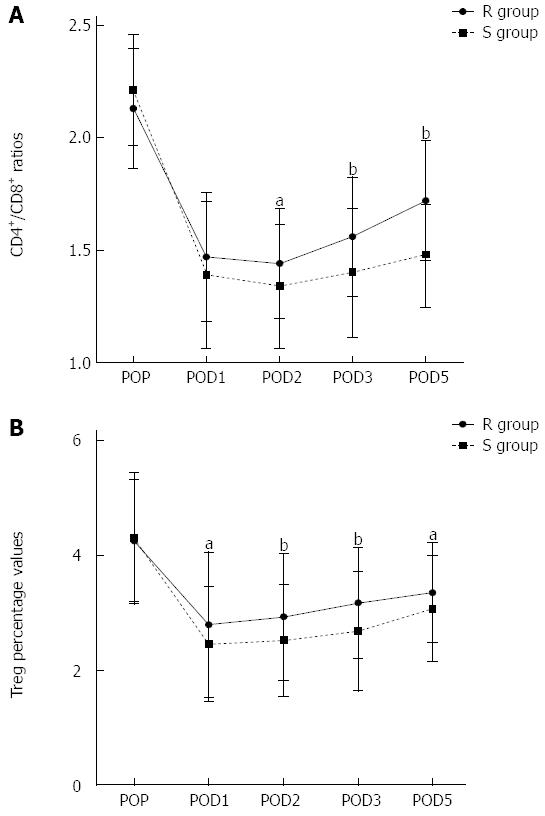
Figure 4 Evolution of peripheral blood CD4+/CD8+ ratios and Treg percentage values in two groups.
Data are mean ± SD. POP: Pre-operation; POD: Postoperative day; R group: Restricted fluid therapy group; S group: Standard fluid therapy group. aP < 0.05, bP < 0.01 R group vs S group.
- Citation: Jie HY, Ye JL, Zhou HH, Li YX. Perioperative restricted fluid therapy preserves immunological function in patients with colorectal cancer. World J Gastroenterol 2014; 20(42): 15852-15859
- URL: https://www.wjgnet.com/1007-9327/full/v20/i42/15852.htm
- DOI: https://dx.doi.org/10.3748/wjg.v20.i42.15852


