Copyright
©2014 Baishideng Publishing Group Inc.
World J Gastroenterol. Nov 7, 2014; 20(41): 15351-15357
Published online Nov 7, 2014. doi: 10.3748/wjg.v20.i41.15351
Published online Nov 7, 2014. doi: 10.3748/wjg.v20.i41.15351
Figure 1 Significant difference between resistin level in acute biliary pancreatitis patients and control subjects (P = 0.
000).
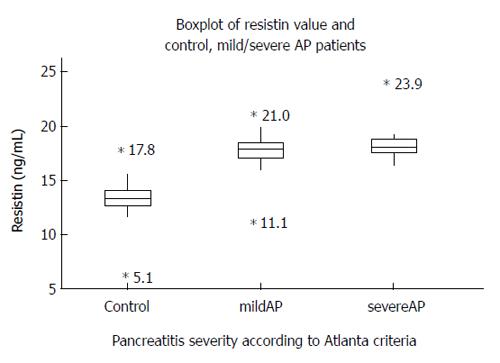
Figure 2 Box plot graph delineates the difference variation between acute pancreatitis patients (mild/severe) and control group.
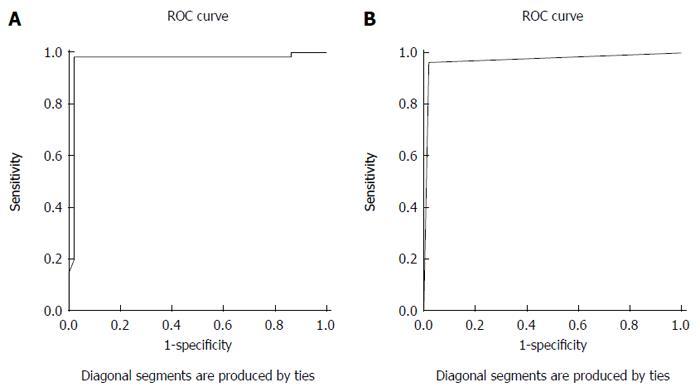
Figure 3 Receiver-operator curve and area under the curve.
A: Receiver-operator curve (ROC) and area under the curve (AUC) delineate sensitivity and specificity of serum resistin concentration (day of admission), AUC > 97%, P-value < 0.0001; B: ROC and AUC of serum resistin value on admission. Cutoff value: 15 ng/mL and positive predictive value: 97%.
- Citation: Al-Maramhy H, Abdelrahman AI, Sawalhi S. Resistin is not an appropriate biochemical marker to predict severity of acute pancreatitis: A case-controlled study. World J Gastroenterol 2014; 20(41): 15351-15357
- URL: https://www.wjgnet.com/1007-9327/full/v20/i41/15351.htm
- DOI: https://dx.doi.org/10.3748/wjg.v20.i41.15351


