Copyright
©2014 Baishideng Publishing Group Inc.
World J Gastroenterol. Nov 7, 2014; 20(41): 15299-15309
Published online Nov 7, 2014. doi: 10.3748/wjg.v20.i41.15299
Published online Nov 7, 2014. doi: 10.3748/wjg.v20.i41.15299
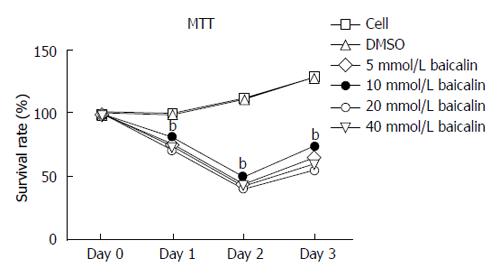
Figure 1 Cell proliferation rate (%) of CD4+CD29+ cells affected by baicalin in vitro.
bP < 0.01 vs control group (cell).
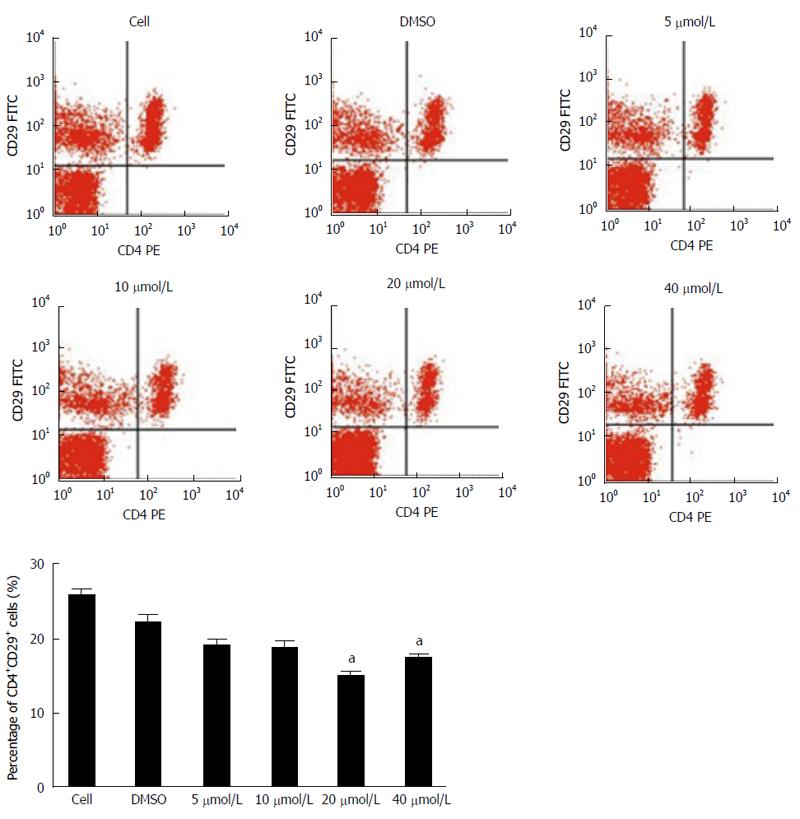
Figure 2 Percentage of CD4+CD29+ cells detected by flow cytometry at 72 h after cells were incubated in different concentrations of baicalin in vitro.
aP < 0.05 vs control group (cell).
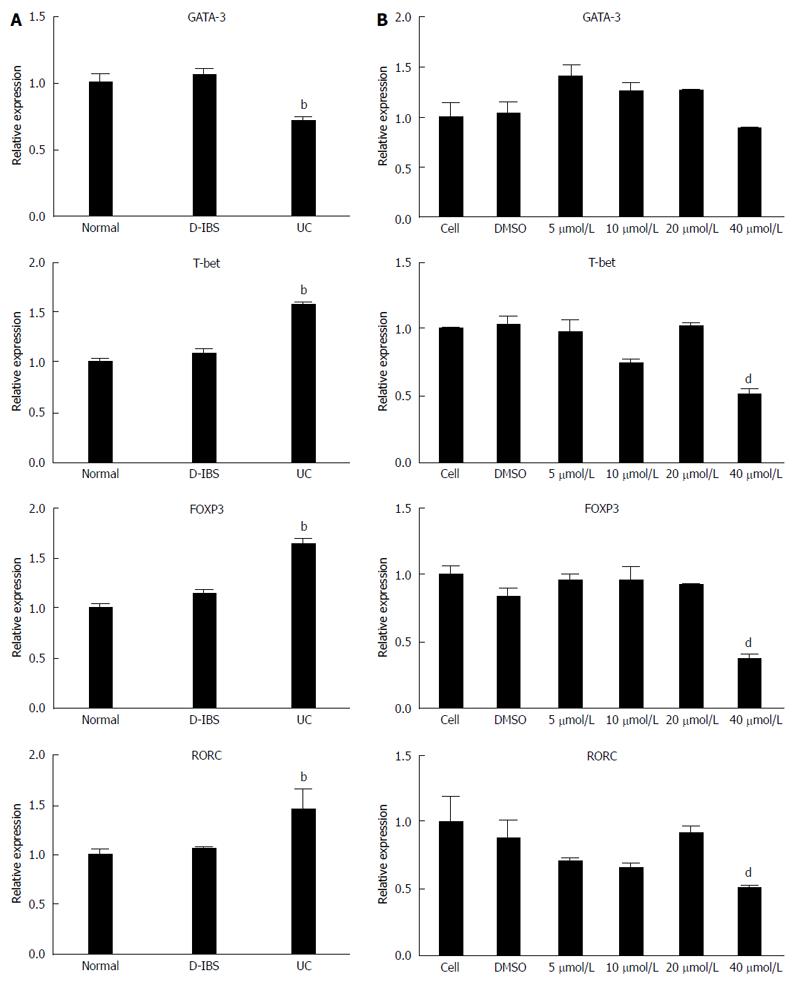
Figure 3 Relative expression of GATA-3, T-bet, FOXP3 and RORC by qRT-PCR.
A: GATA-3, T-bet, FOXP3 and RORC expression level in tissues from normal, D-IBS and UC patients. bP < 0.01 vs control group (normal); B: GATA-3, T-bet, FOXP3 and RORC expression level in cells treated with 5 μmol/L, 10 μmol/L, 20 μmol/L and 40 μmol/L baicalin. dP < 0.01 vs control group (cell). UC: Ulcerative colitis; RORC: Related orphan nuclear hormone receptor C; T-bet: T-box expressed in T cells.
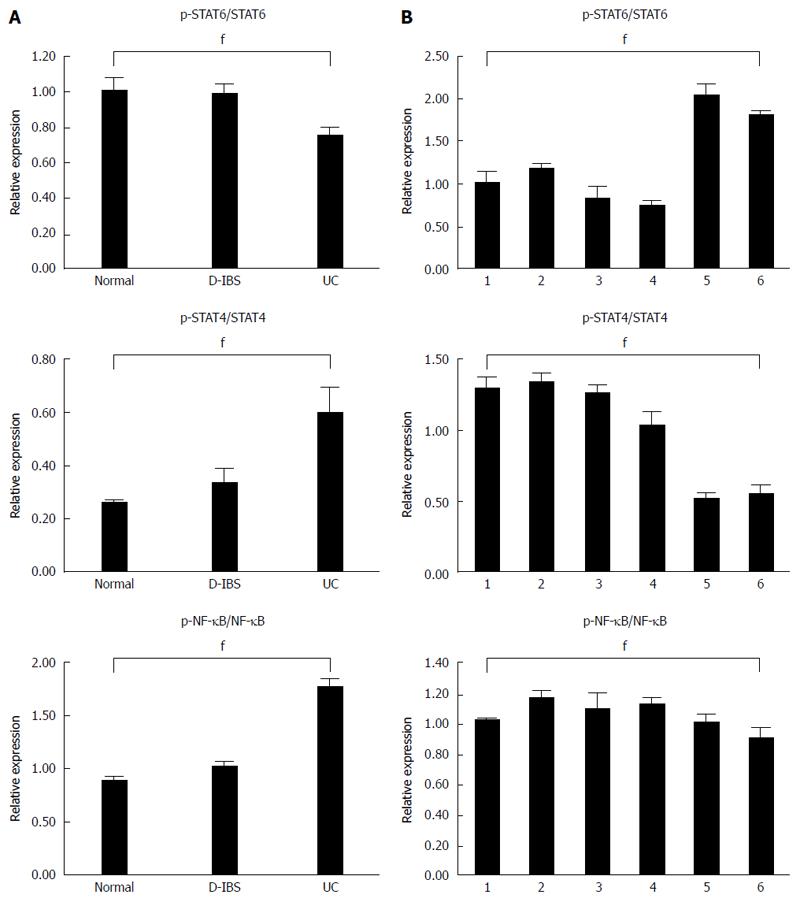
Figure 4 Expression of proteins in tissues and cells treated with different concentrations of baicalin by western blot assay.
A: Western blot assay was performed to detect the expression level of STAT6, STAT4, NF-κB and their phosphorylated proteins in tissues and cells treated with baicalin. GAPDH was used as the control; B: The ratio of p-STAT6/STAT6, p-STAT4/STAT4 and p-NF-κB/NF-κB in normal, D-IBS and UC tissues. fP < 0.01 vs control group. UC: Ulcerative colitis.
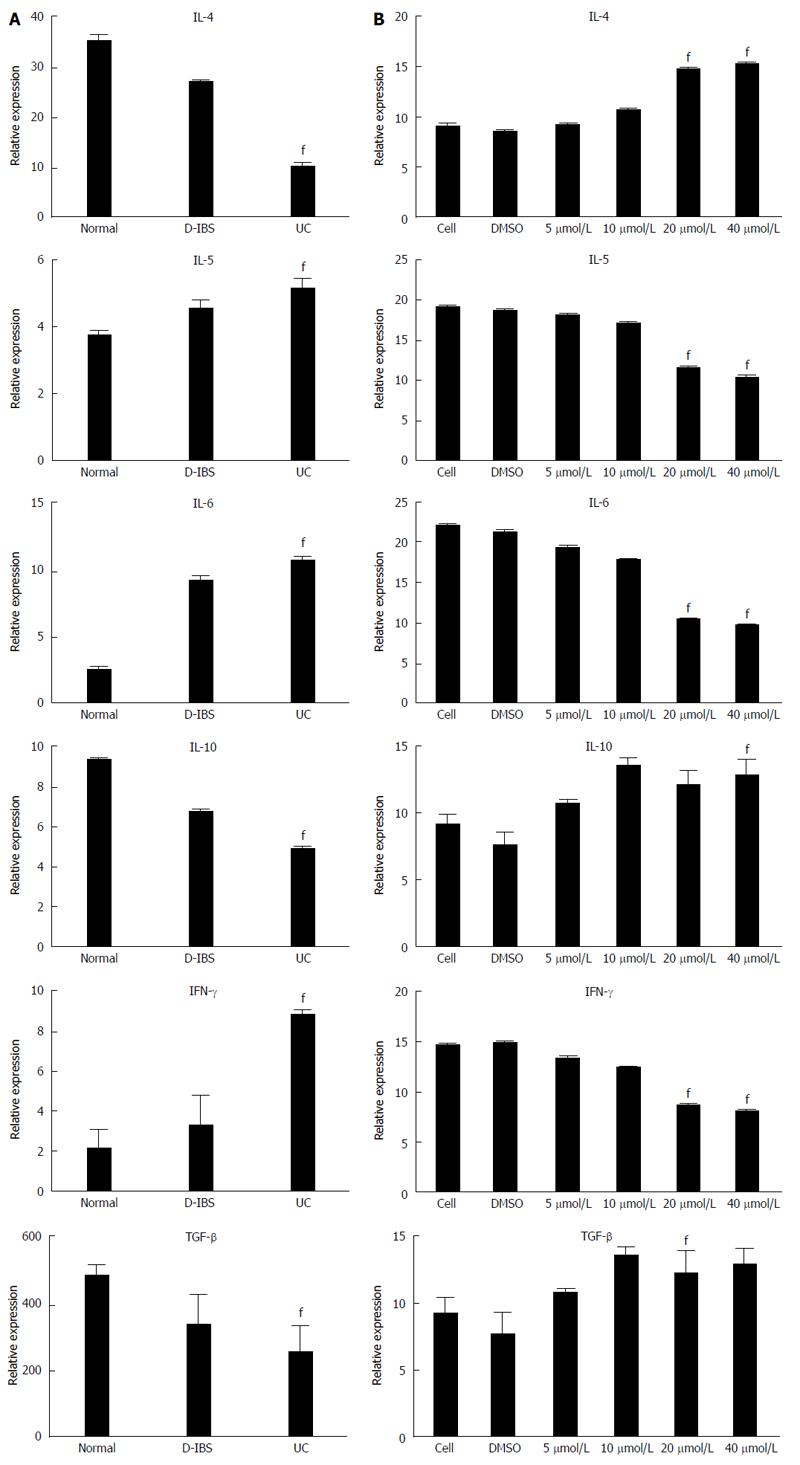
Figure 5 Relative expression of several cytokines in tissues and cells treated with different concentrations of baicalin by ELISA assay.
A: Cytokines were detected in normal, D-IBS and UC serum samples; B: Relative expression of cytokines in the supernatant of cells treated with 5 μmol/L, 10 μmol/L, 20 μmol/L and 40 μmol/L baicalin; fP < 0.01 vs control group. IFN: Interferon; IL: Interleukin.
- Citation: Yu FY, Huang SG, Zhang HY, Ye H, Chi HG, Zou Y, Lv RX, Zheng XB. Effects of baicalin in CD4 + CD29 + T cell subsets of ulcerative colitis patients. World J Gastroenterol 2014; 20(41): 15299-15309
- URL: https://www.wjgnet.com/1007-9327/full/v20/i41/15299.htm
- DOI: https://dx.doi.org/10.3748/wjg.v20.i41.15299


