Copyright
©2014 Baishideng Publishing Group Inc.
World J Gastroenterol. Oct 28, 2014; 20(40): 14965-14972
Published online Oct 28, 2014. doi: 10.3748/wjg.v20.i40.14965
Published online Oct 28, 2014. doi: 10.3748/wjg.v20.i40.14965
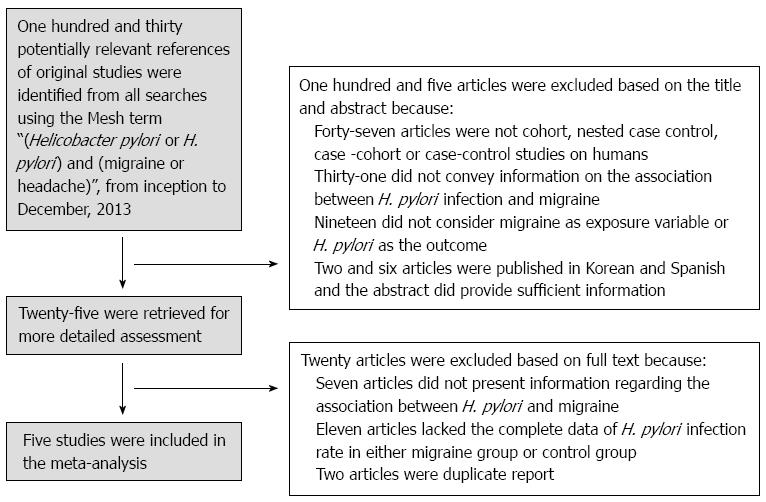
Figure 1 Flow diagram of the study selection process.
H. pylori: Helicobacter pylori.
Figure 2 Meta-analysis of the prevalence of Helicobacter pylori infection in the migraine group compared with the control group.
Weights are from random effects analysis.
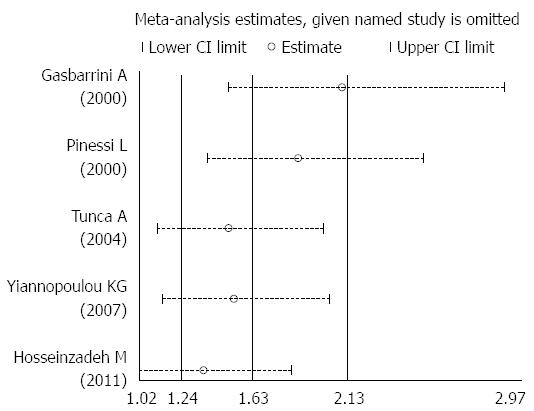
Figure 3 Sensitivity analysis of the five included studies.
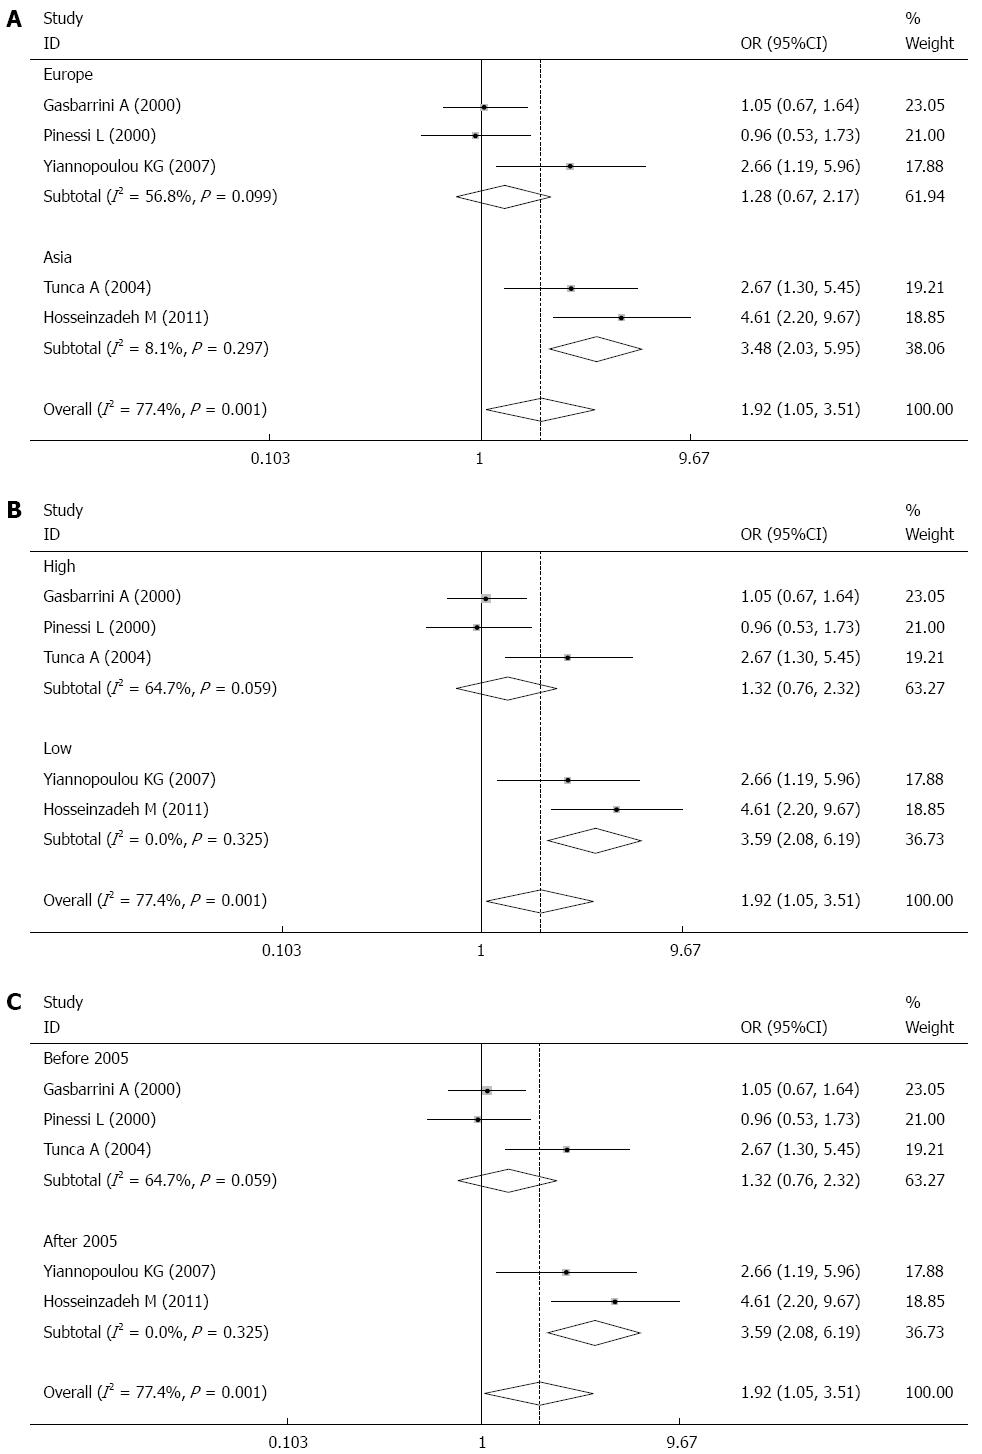
Figure 4 Forest graph of Helicobacter pylori infection.
Weights are from random effects analysis. A: Stratified by geographic distribution; B: Stratified by the quality of evidence for each included study; C: Stratified by the publication year.
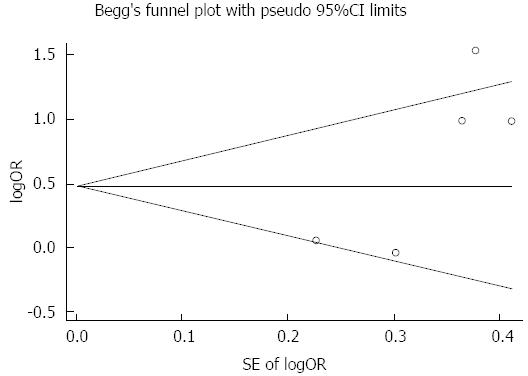
Figure 5 Funnel plot to detect publication bias.
-
Citation: Su J, Zhou XY, Zhang GX. Association between
Helicobacter pylori infection and migraine: A meta-analysis. World J Gastroenterol 2014; 20(40): 14965-14972 - URL: https://www.wjgnet.com/1007-9327/full/v20/i40/14965.htm
- DOI: https://dx.doi.org/10.3748/wjg.v20.i40.14965


