Copyright
©2014 Baishideng Publishing Group Inc.
World J Gastroenterol. Sep 28, 2014; 20(36): 13088-13104
Published online Sep 28, 2014. doi: 10.3748/wjg.v20.i36.13088
Published online Sep 28, 2014. doi: 10.3748/wjg.v20.i36.13088
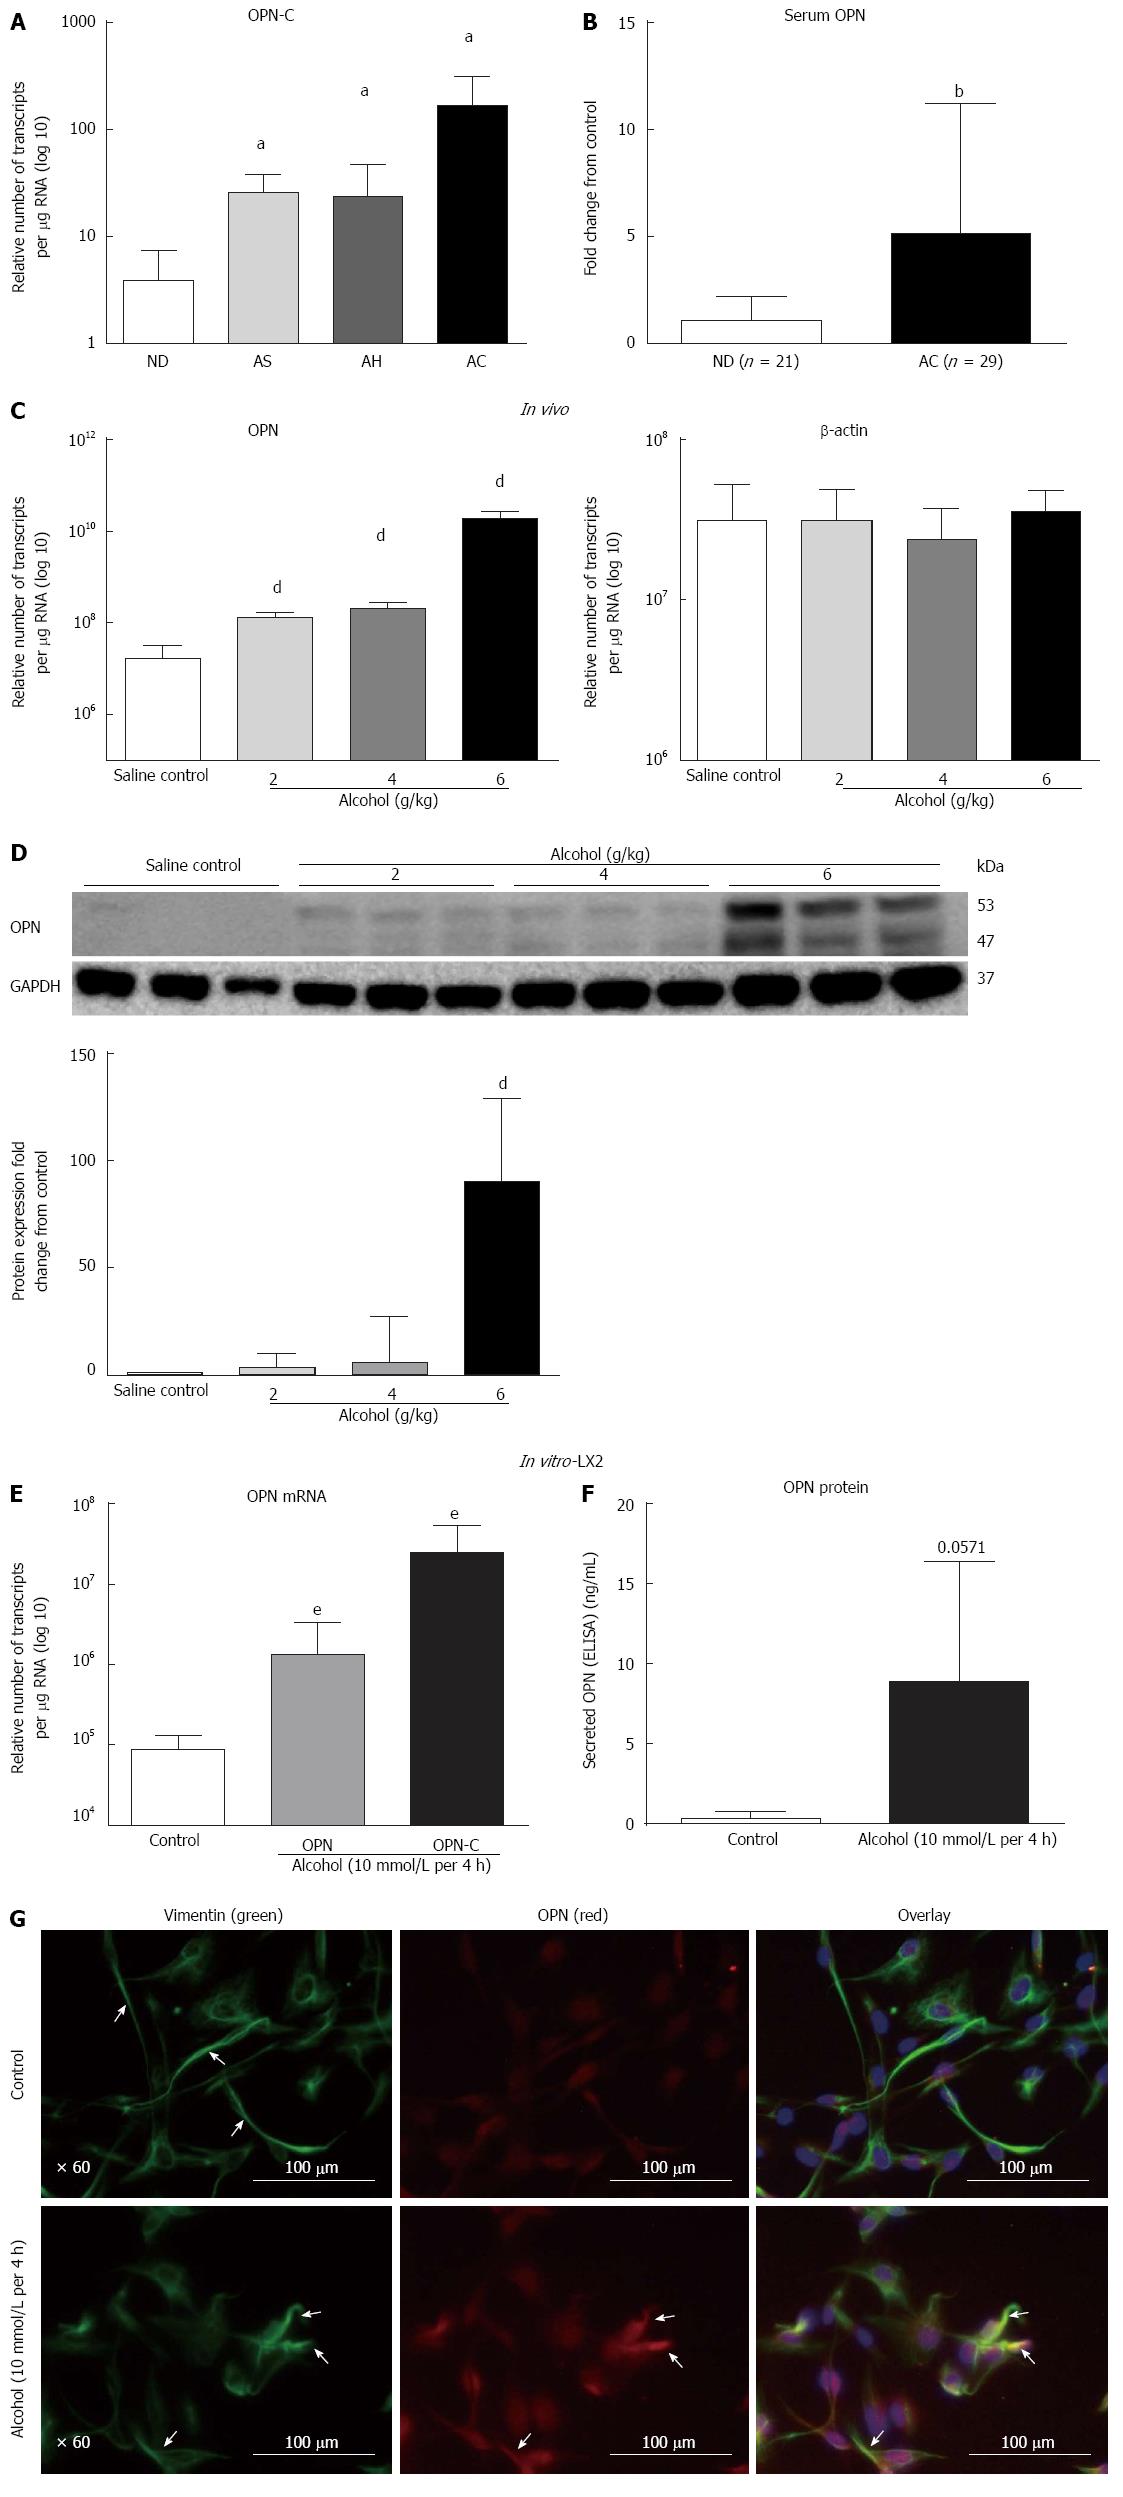
Figure 1 Over-expression of Osteopontin expression increased in human alcoholic liver disease, in vivo alcoholic steatosis mouse model and in vitro in stellate LX2 cells with a single acute dose of alcohol.
A: Over-expression of Osteopontin (OPN)-C isoform mRNA (per ìg total RNA) increased progressively in livers from patients with alcoholic steatosis (AS), alcoholic hepatitis (AH) and alcoholic cirrhosis (AC) compared to non-diseased (ND) donor livers; B: Circulating OPN protein significantly increased (> 4-fold) in serum from patients with alcoholic cirrhosis compared to non-diseased alcoholics; C: In vivo: Hepatic OPN mRNA expression significantly increased from saline control with increasing doses of 2, 4 and 6 g/kg alcohol in wild type mice. No change was observed for â-actin expression used as control; D: Full length (about 53 kD) and cleaved (about 47 kD) OPN protein expression was visible with all alcohol doses (WB panel) and significantly increased with 6 g/kg alcohol on quantitation, normalized to glyceraldehyde-3-phosphate dehydrogenase (GAPDH) (bar graph); E: In vitro: Isoforms OPN-A (15-fold) and OPN-C (about 286-fold) mRNAs (transcripts per ìg total RNA) significantly increased with a single acute dose of alcohol (10 mmol/L per 4 h) compared to untreated control cells; F: Total secreted OPN protein (enzyme-linked immunosorbent assay) in culture media from alcohol treated LX2 cells also increased with respect to control cells but did not reach significance; G: Intracellular OPN (red) was associated with alcohol-induced LX2 activation (green) observed as recessed processes in alcohol treated LX2 compared to control cells (immunofluorescence). Overlay shows increased expression of OPN in LX2 cells exposed to alcohol. aP < 0.05, bP < 0.01 vs ND; dP < 0.01 vs saline control; eP < 0.01 vs control.
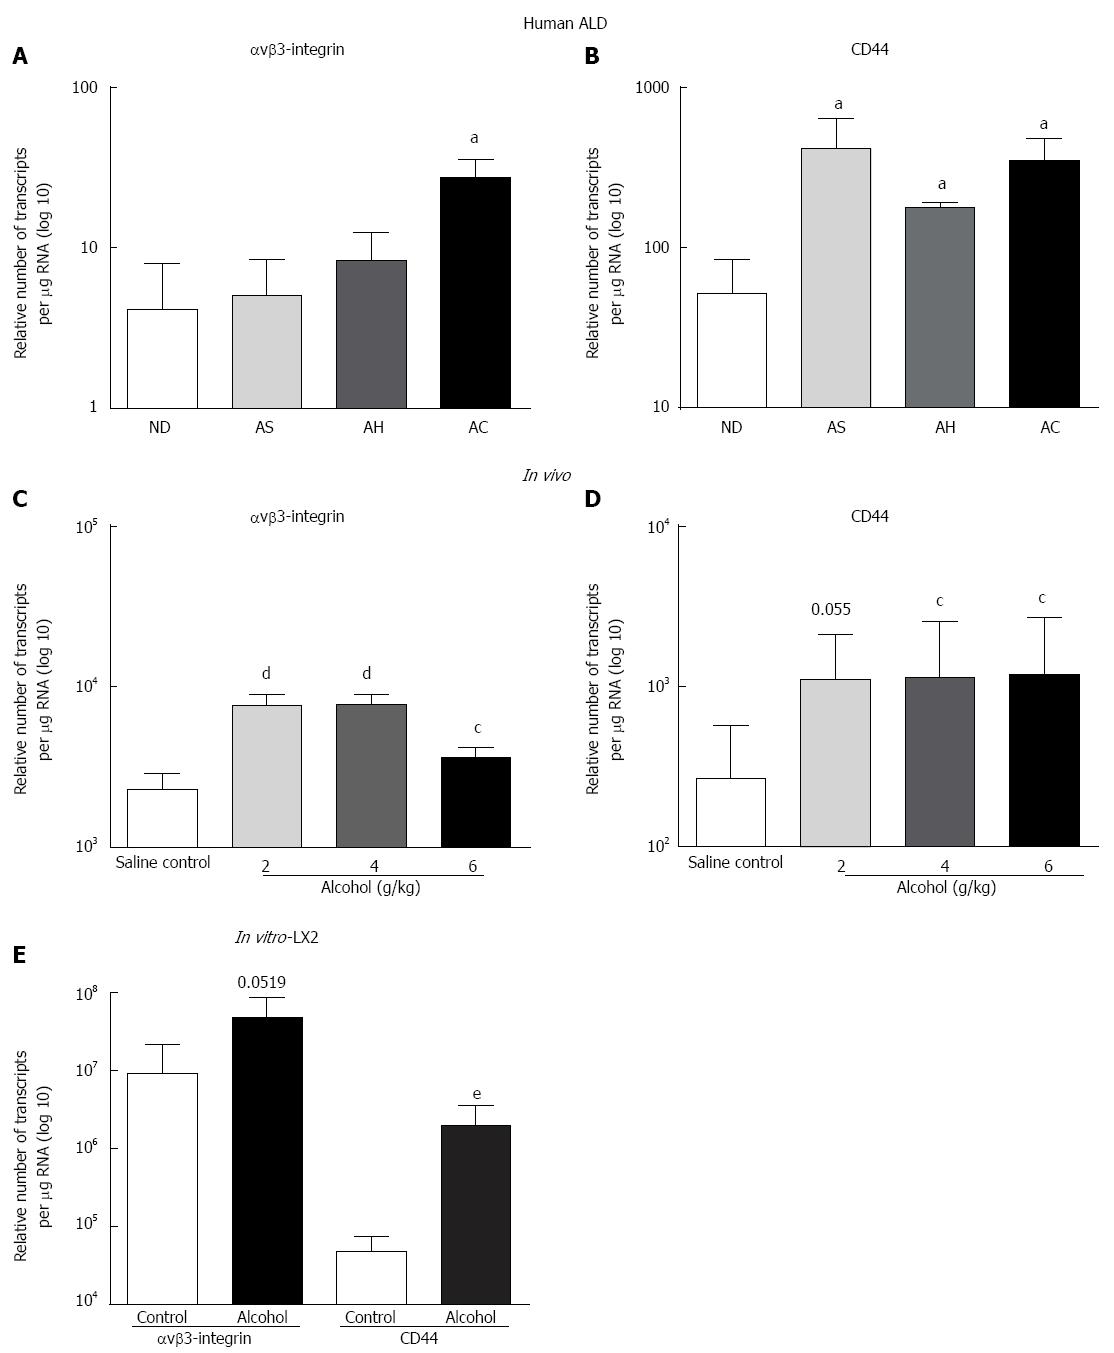
Figure 2 Increased expression of over-expression of Osteopontin cognate receptors αvβ3-integrin and CD44 in human alcoholic liver disease; in vivo in mice and in vitro in LX2 cells with a single acute dose of alcohol.
Increase in αvβ3-integrin mRNA (transcripts per ìg total RNA) was observed with disease progression in human alcoholic liver disease (ALD), but only reached significance in alcoholic cirrhosis (AC) compared to non-diseased (ND) (A); CD44v6 mRNA significantly increased in all ALD stages (B). In vivo, all alcohol doses significantly increased mRNA expression of αvβ3-integrin (C) but CD44 reached significance only at 4 g/kg and 6 g/kg (D). Alcohol (10 mmo/L per 4 h) also increased both αvβ3-integrin and CD44 mRNA expression in LX2 cells compared to control (E). aP < 0.05 vs ND; cP < 0.05, dP < 0.01 vs saline control; eP < 0.01 vs control. AS: Alcoholic steatosis; AH: Alcoholic hepatitis.
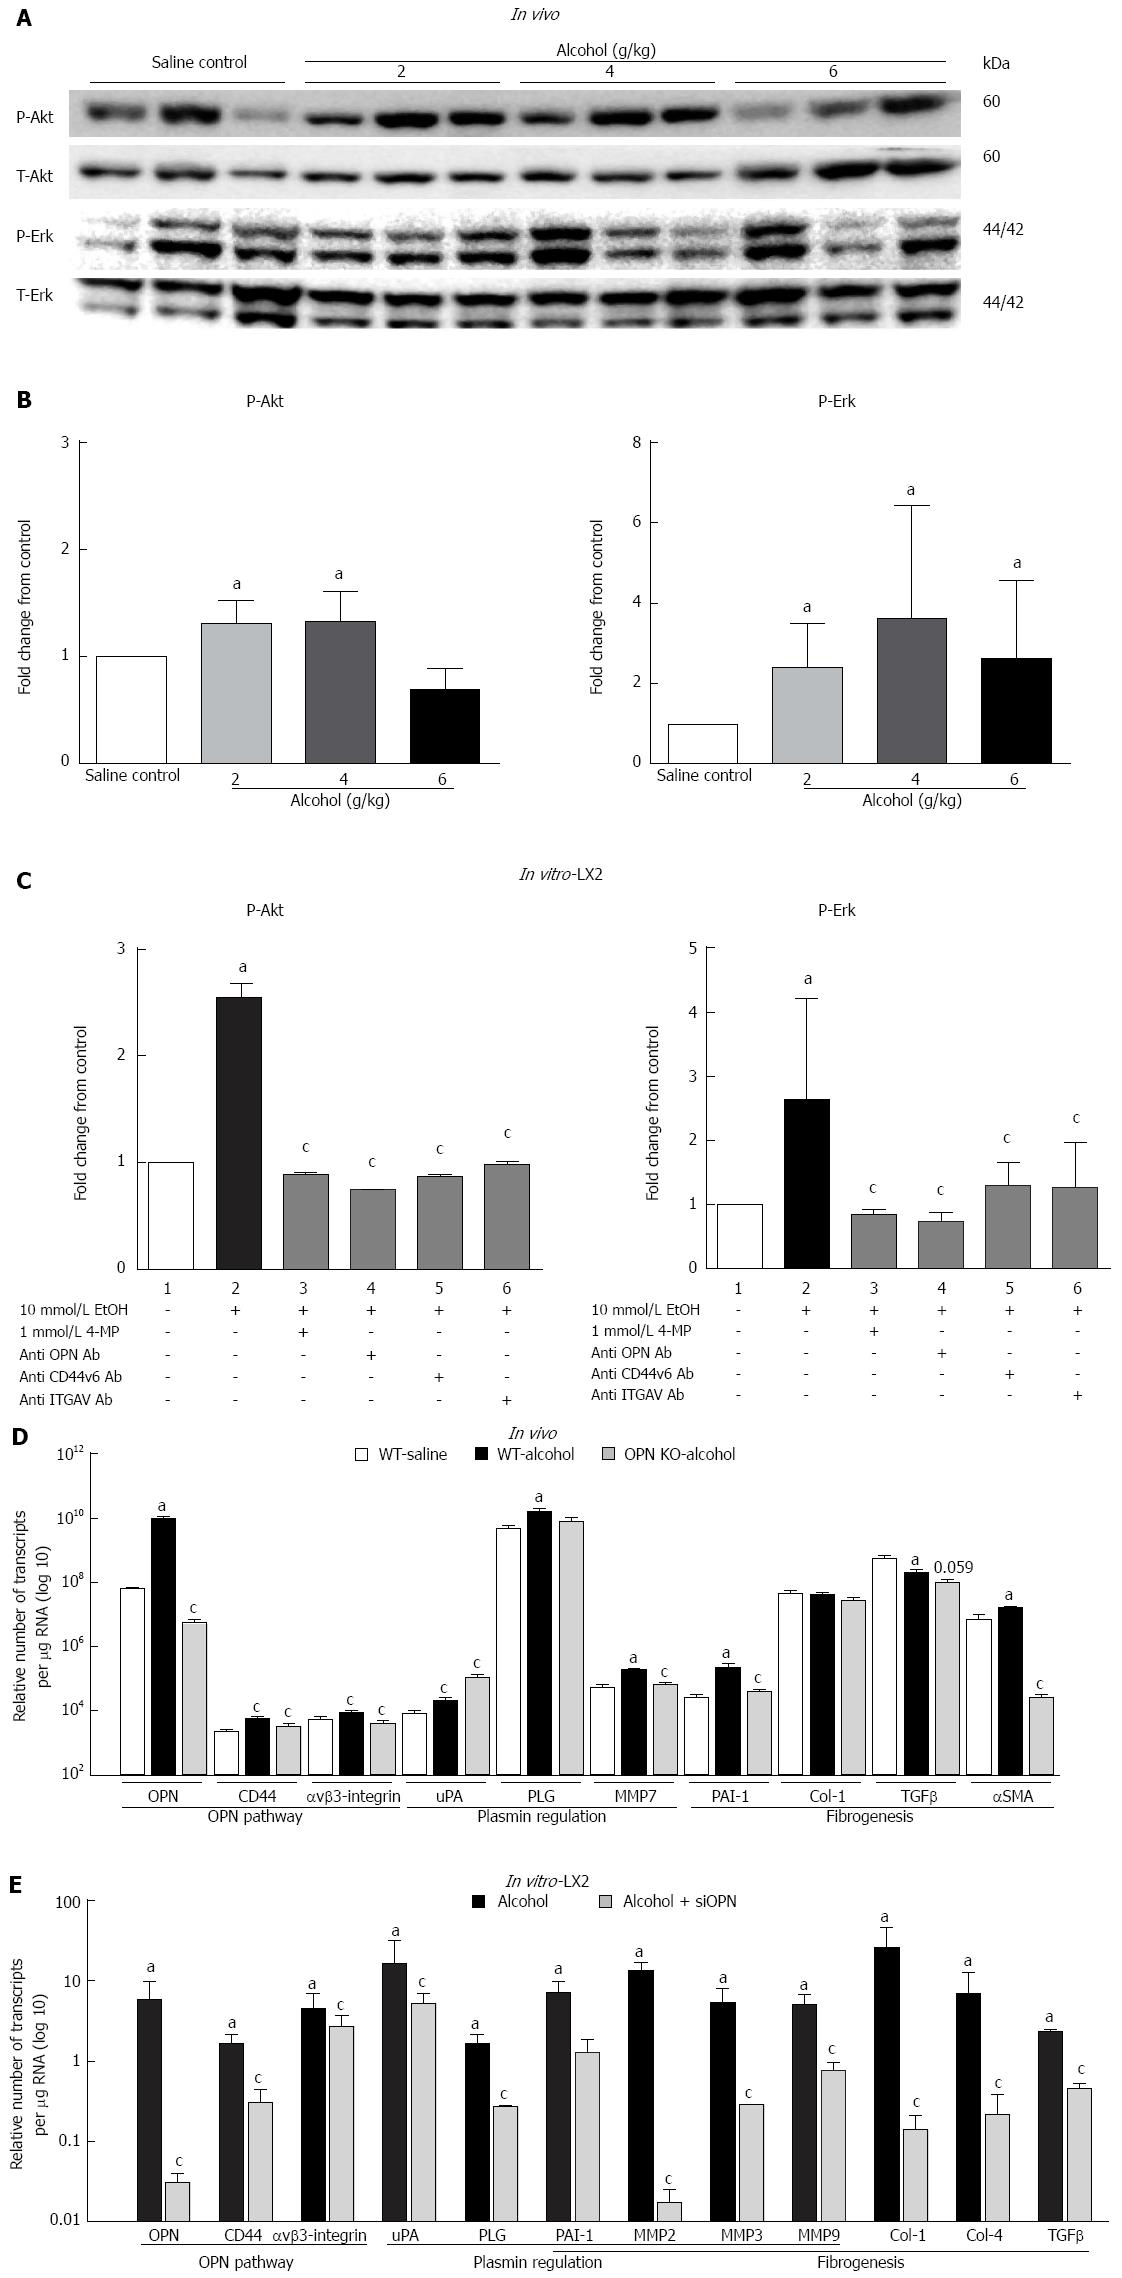
Figure 3 Over-expression of Osteopontin mediates alcohol-induced cell signalling and downstream transcription of target genes in in vivo and in vitro experimental models.
A, B: In vivo: Compared to saline control, significant but moderate increase was observed in P-Akt/T-Akt ratio (WB, top panels) with 2 and 4 g/kg alcohol (P-Akt graph) and P-Erk/T-Erk ratio (WB, bottom panels) with all doses of alcohol (P-Erk graph). Note: individual mice showing high P-Erk had low P-Akt and vice versa. aP < 0.05 vs saline control; C: In vitro: Compared to untreated cells (lane 1), alcohol (10 mmo/L per 4 h) (lane 2) significantly induced P-Akt (P-Akt graph) and P-Erk (P-Erk graph) in LX2, normalized to total -Akt (T-Akt) and -Erk (T-Erk), respectively. Phosphorylation of both Akt and Erk was abrogated by inhibiting alcohol metabolism through 4-methyl pyrazole (4-MP) (lane 3) and blocking OPN pathway by neutralizing antibodies to OPN (lane 4), CD44v6 (lane 5) and αvβ3-integrin (ITGAV) (lane 6). aP < 0.05 vs untreated cells; cP < 0.05 vs alcohol; D: In vivo: In WT mice, mRNA expression (transcripts per μg total RNA) for OPN pathway (OPN, CD44, αvβ3-integrin), plasmin regulation (ìPA, PLG, MMP7) and fibrogenesis (PAI-1, α-SMA) related molecules were significantly induced by alcohol (6 g/kg, dark bars) compared to saline control (white bars). TGFβ mRNA was down-regulated and Col-1 was not affected. mRNA expression of most molecules was significantly inhibited in OPN knockout mice (grey bars) compared to WT mice in the presence of alcohol. ìPA mRNA expression significantly increased in OPN-/- mice and Col-1 mRNA did not change. aP < 0.05 vs control; cP < 0.05 vs alcohol; E: In vitro: Alcohol induced mRNA expression (fold-change from no treatment/scramble control) for OPN, CD44v6, αvβ3-integrin, ìPA, PLG, PAI-1, MMP2, MMP3, MMP9, Col-1, Col-4 and TGFβ (dark bars, presented as fold-change from no treatment control). Silencing OPN in LX2 cells with siOPN significantly inhibited mRNA expression of these molecules, except αvβ3-integrin and ìPA in the presence of alcohol (grey bars, presented as fold-change from scrambled control). aP < 0.05 vs control; cP < 0.05 vs alcohol.
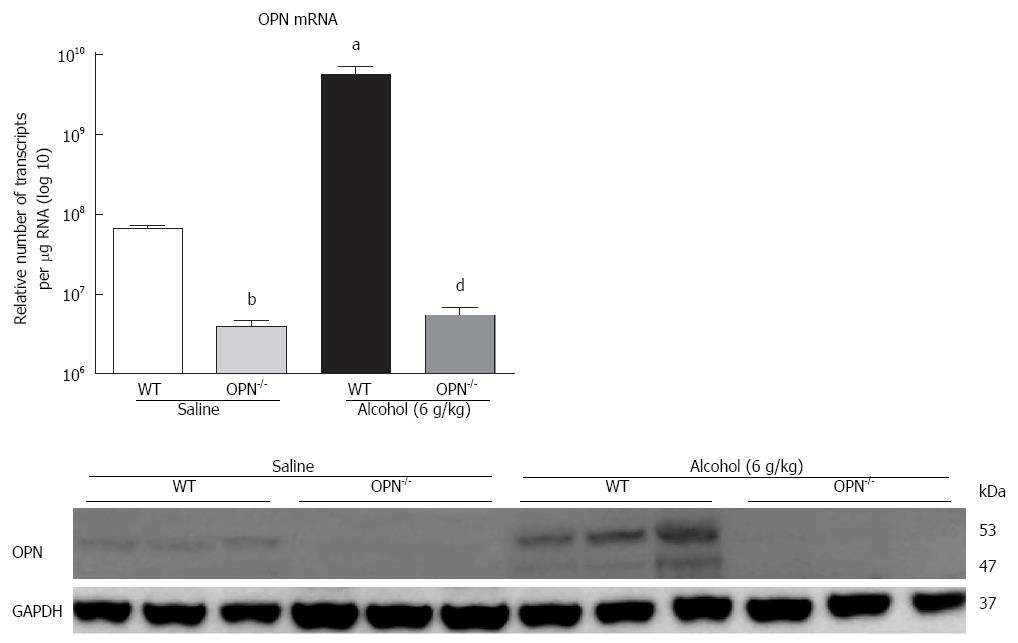
Figure 4 Over-expression of Osteopontin expression is inhibited in over-expression of Osteopontin-/- animals.
Over-expression of Osteopontin (OPN) mRNA was significantly inhibited and protein was not observed in OPN-/- animals compared to WT with or without alcohol. n = 6-8 per group; aP < 0.05, bP < 0.01 vs WT in saline; dP < 0.01 vs WT in alcohol.
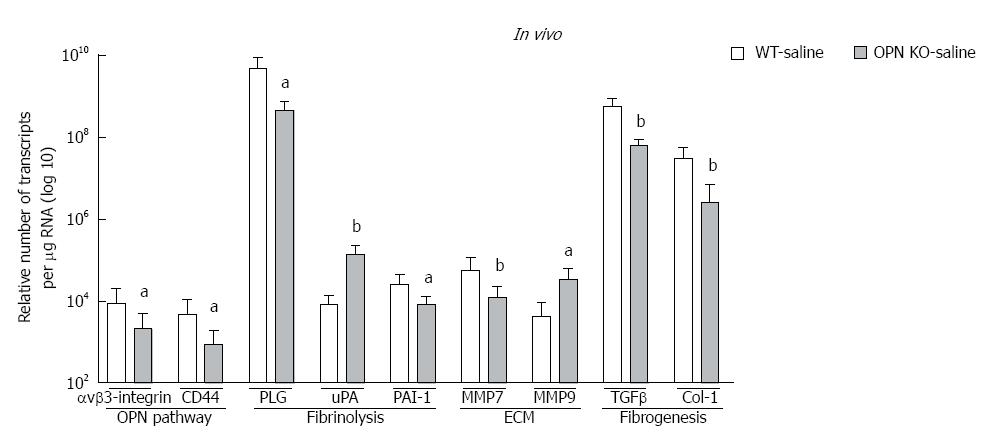
Figure 5 Knocking down over-expression of Osteopontin inhibits/increases mRNAs (log 10) related to plasmin, extracellular matrix and fibrogenesis.
Associated with Osteopontin (OPN) knockout, mRNA expression of αvβ3-integrin, CD44, PLG, PAI-1, MMP7, TGF-β, α-SMA and Col1 was significantly down-regulated but ìPA and MMP9 were up-regulated in OPN-/- compared to WT control mice. n = 6-8 per group; aP < 0.05, bP < 0.01 vs WT-saline.
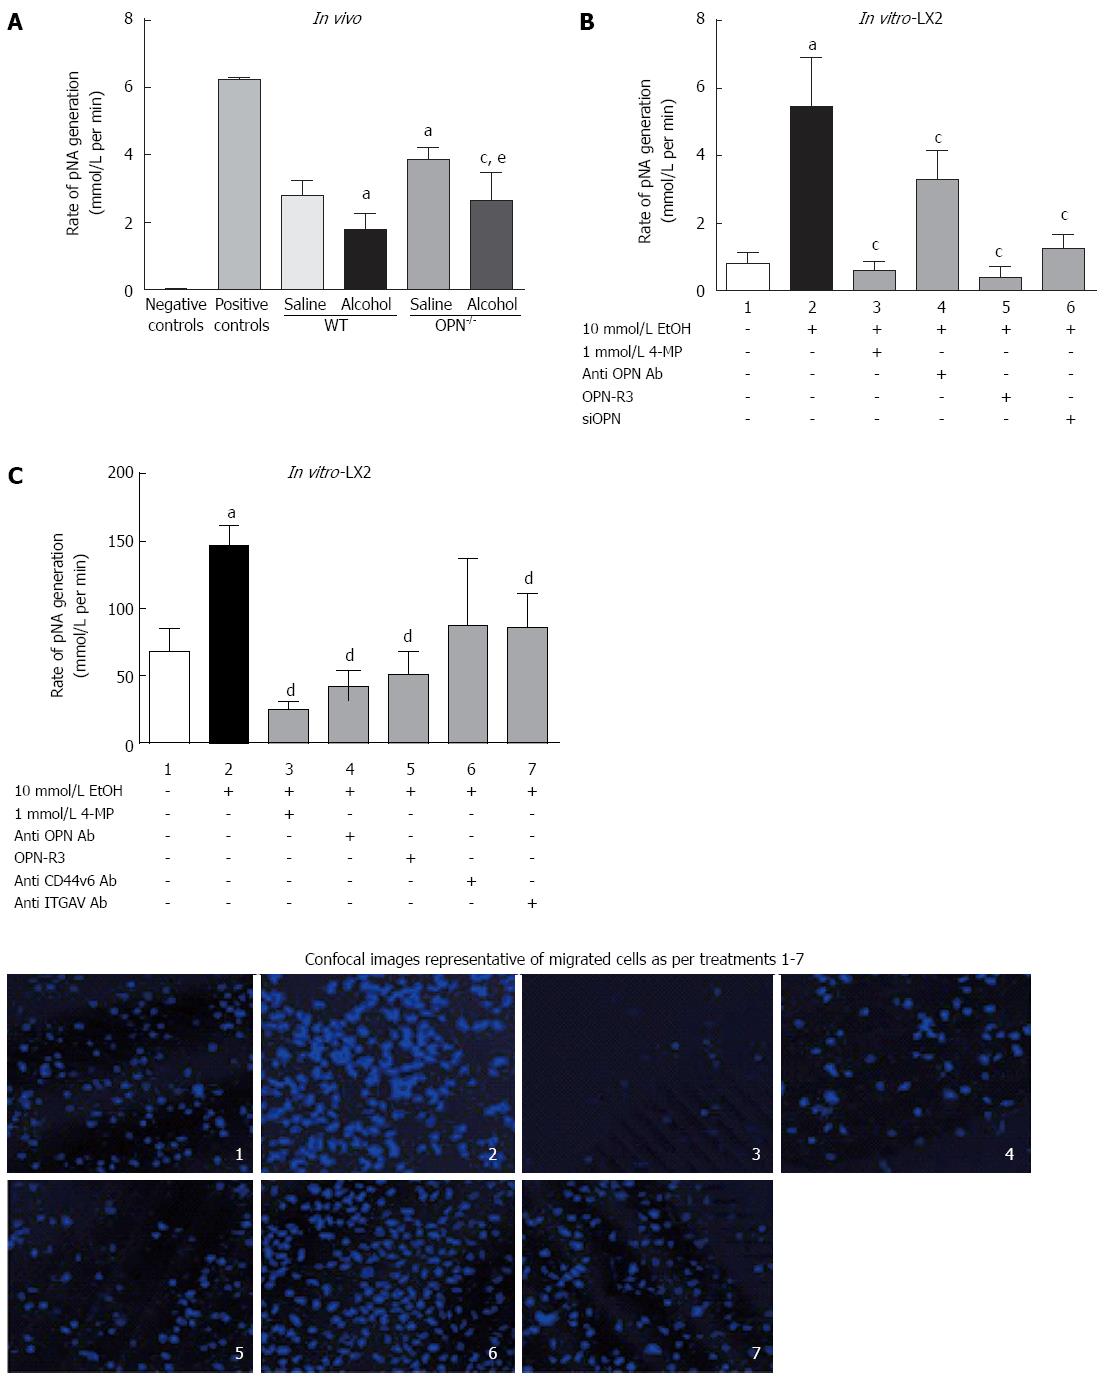
Figure 6 Alcohol-induced plasmin activation is mediated via over-expression of Osteopontin.
A: In vivo: Plasmin activity (pNA mol/L per minute) was significantly inhibited with alcohol (6 g/kg) administration compared to saline control both in WT and Osteopontin (OPN)-/- mice. Conversely, basal plasmin activity was significantly higher in untreated OPN-/- compared to WT mice. ìPA and buffer alone were used as positive and negative controls, respectively. aP < 0.05 vs saline in WT; cP < 0.05 vs saline in OPN-/-; eP < 0.05 vs alcohol in WT; In vitro: B: Alcohol (10 mmol/L) significantly increased plasmin activity > 5-fold in LX2 (lane 2) compared to untreated cells (lane 1), which was significantly inhibited with 4-MP (lane 3), anti-OPN antibody (lane 4), OPN-R3 aptamer (lane 5) and OPN siRNA (siOPN) (lane 6). aP < 0.05 vs untreated cells; cP < 0.05 vs LX2; C: Compared to untreated cells (lane 1), LX2 cell migration (% migrated/non-migrated) significantly increased by 1.7-fold with alcohol (10 mmol/L) (lane 2) and was inhibited with 4-MP (lane 3). Blocking OPN with anti-OPN antibody (lane 4) and OPN-R3 aptamer (lane 5) and OPN binding with anti-ITGAV antibody (lane 7) significantly reduced LX2 cell migration. Cell migration was moderately reduced with anti-CD44v6 and did not reach significance. Confocal (panel) shows typical images of migrated cells for each treatment. Migration was quantitated by counting Hoechst stained cells (blue nuclei) using confocal images in at least six fields per treatment. aP < 0.05 vs untreated cells; dP < 0.01 vs alcohol.
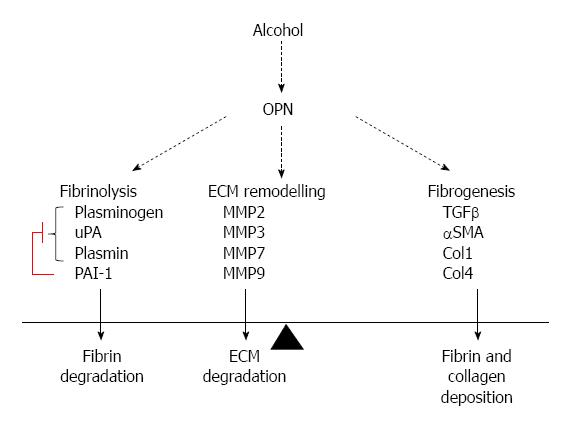
Figure 7 Pathways in a chronic alcoholic liver injury model.
Col1: Collagen 1; ECM: Extracellular matrix.
-
Citation: Seth D, Duly A, Kuo PC, McCaughan GW, Haber PS. Osteopontin is an important mediator of alcoholic liver disease
via hepatic stellate cell activation. World J Gastroenterol 2014; 20(36): 13088-13104 - URL: https://www.wjgnet.com/1007-9327/full/v20/i36/13088.htm
- DOI: https://dx.doi.org/10.3748/wjg.v20.i36.13088


