Copyright
©2014 Baishideng Publishing Group Inc.
World J Gastroenterol. Sep 28, 2014; 20(36): 12860-12873
Published online Sep 28, 2014. doi: 10.3748/wjg.v20.i36.12860
Published online Sep 28, 2014. doi: 10.3748/wjg.v20.i36.12860
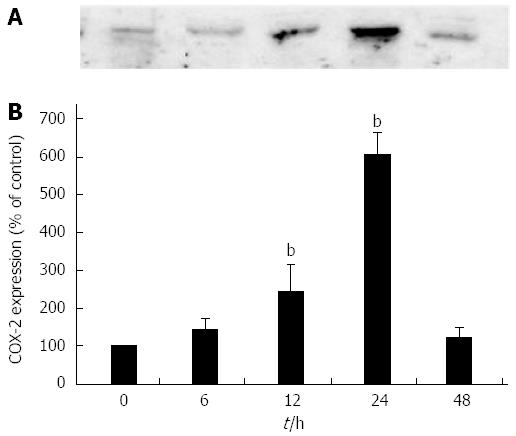
Figure 1 Time course of Helicobacter pylori water extracts on cyclooxygenase-2 expression in rat gastric mucosa cells.
Western blot analysis was performed on cell lysates (50 μg) from rat gastric mucosa (RGM1) cells incubated for 0, 6, 12, 24 or 48 h with 10 μg/mL Helicobacter pylori (H. pylori) water extracts. The top panel (A) shows representative of three separate experiments undertaken. The histogram at the bottom (B) represents the means ± SD of densitometric values for the cyclooxygenase-2 (COX-2) bands obtained from three independent experiments. Data are expressed as the percentages of the densities of the control cells incubated with H. pylori water extracts for 0 h, and analyzed using ANOVA with Dunnett’s multiple comparison test of the means. bP < 0.01 vs 0 h. Reproduced from Ref [90] with permission.
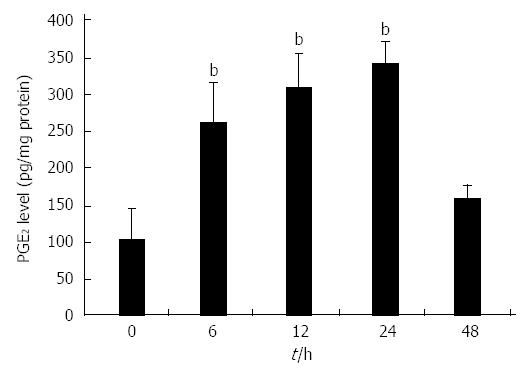
Figure 2 Effect of Helicobacter pylori water extracts on PGE2 synthesis in rat gastric mucosa cells.
Rat gastric mucosa (RGM1) cells were incubated for 0, 6, 12, 24, or 48 h with 10 μg/mL Helicobacter pylori water extracts. PGE2 levels in the media of RGM1 cells were measured by enzyme-linked immunosorbent assay and expressed as pg/mg protein. Data are shown as mean ± SD, n = 5 per group, and analyzed using ANOVA with Dunnett's multiple comparison test of the means. bP < 0.01 vs the control or 0 h. Reproduced from Ref [90] with permission.
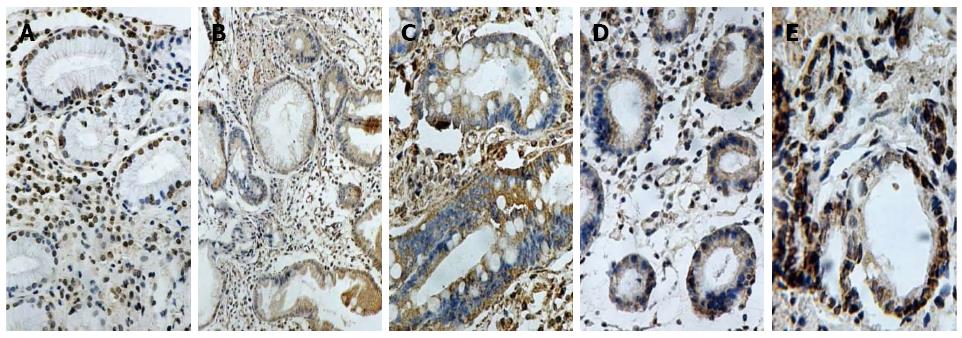
Figure 3 Immunostaining for cyclooxygenase-2 in the gastric mucosa with chronic superficial gastritis (A), gastric glandular atrophy (B), intestinal metaplasia (C), dysplasia (D) and gastric cancer (E).
Chronic superficial gastritis shows strong expression in foveolar and glandular epithelium and weak expression in mononuclear inflammatory cells, myofibroblasts, and endothelial cells in the lamina propria; gastric glandular atrophy shows strong expression in the atrophic glands of the gastric mucosa; intestinal metaplasia shows strong expression in intestinal epithelium and goblet cells; and gastric cancer shows strong expression in cancer cells. Reproduced from Ref [21].
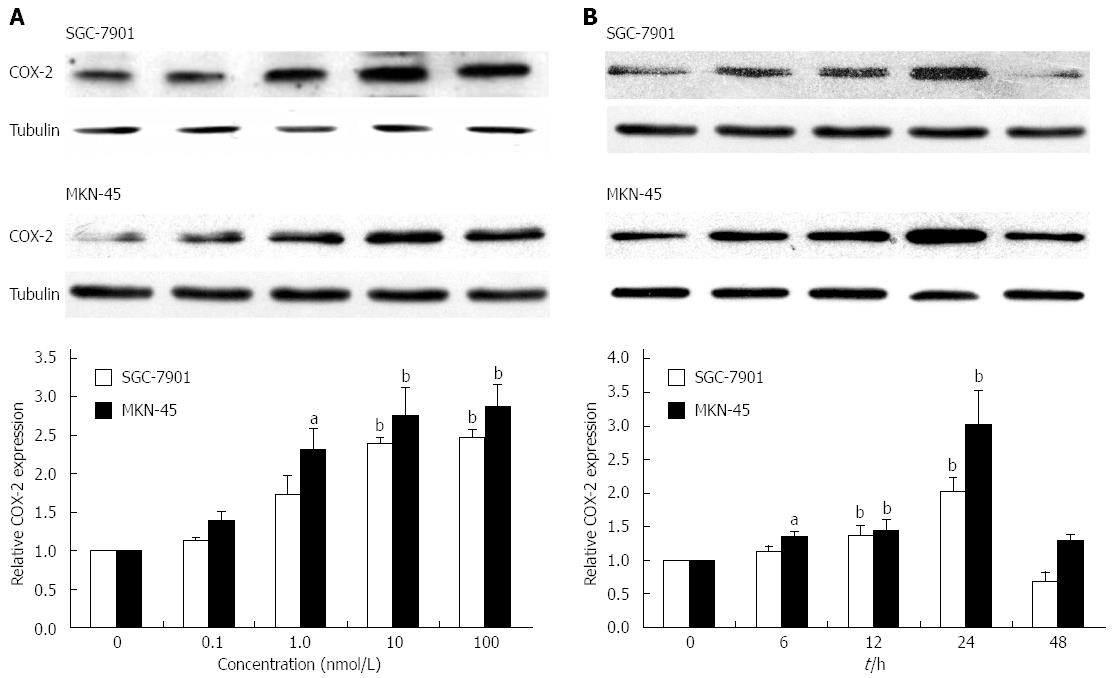
Figure 4 Mature amidated gastrin (G17) induces cyclooxygenase-2 expression in gastric cancer cells.
Western blot analysis was performed on cell lysates (30 μg) from SGC-7901 and MKN-45 cells cultured for 24 h with increasing concentrations of G17 (A), or with G17 at 10 nmol/L for the indicated time points (B). The top panels show a representative immunoblot of six separate experiments undertaken. The histograms at the bottom represent the relative expression of cyclooxygenase-2 (COX-2) proteins compared with tubulin. Data represent the mean ± SD of six independent experiments. aP < 0.05, bP < 0.01 vs 0 nmol/L or 0 h. Reproduced from Ref [74] with permission.
Figure 5 Mature amidated gastrin (G17) induces STAT3 and Akt phosphorylation in gastric cancer cells.
SGC-7901 and MKN-45 cells were treated for 30 min with increasing concentrations of G17 (A), or with G17 (10 nmol/L) for the indicated time points (B), as well as pre-treated as indicated with 10 nmol/L CCK2R antagonist YM022 (C) or 40 μmol/L JAK2 inhibitor AG490 (D) or 25 μmol/L PI3K inhibitor LY294002 (E) for 1 h and then incubated with G17 (10 nmol/L) for 30 min to evaluate STAT3 and Akt phosphorylation or for 6 h to evaluate cyclooxygenase-2 (COX-2) expression. SGC-7901 and MKN-45 cells were transfected with either CCK2R-siRNA (F) or CCK2R-pCMV6 (G), followed by G17 (10 nmol/L) treatment for 30 min. Protein extracts were prepared and analyzed for total and phosphorylated forms of STAT3 or Akt by Western blot analysis using corresponding antibodies. The top panels show a representative immunoblot of six separate experiments undertaken. The histograms at the bottom represent the relative expression of phospho-STAT3 (p-STAT3) or phospho-Akt (p-Akt) or COX-2 compared with total STAT3 (t-STAT3) or total Akt (t-Akt) or tubulin, respectively. All data represent the mean ± SD of six independent experiments. aP < 0.05, bP < 0.01 vs control or NC-siRNA or pCMV6; cP < 0.05, dP < 0.01 vs G17. Reproduced from Ref [74] with permission.
-
Citation: Shao Y, Sun K, Xu W, Li XL, Shen H, Sun WH.
Helicobacter pylori infection, gastrin and cyclooxygenase-2 in gastric carcinogenesis. World J Gastroenterol 2014; 20(36): 12860-12873 - URL: https://www.wjgnet.com/1007-9327/full/v20/i36/12860.htm
- DOI: https://dx.doi.org/10.3748/wjg.v20.i36.12860


