Copyright
©2014 Baishideng Publishing Group Inc.
World J Gastroenterol. Sep 7, 2014; 20(33): 11840-11849
Published online Sep 7, 2014. doi: 10.3748/wjg.v20.i33.11840
Published online Sep 7, 2014. doi: 10.3748/wjg.v20.i33.11840
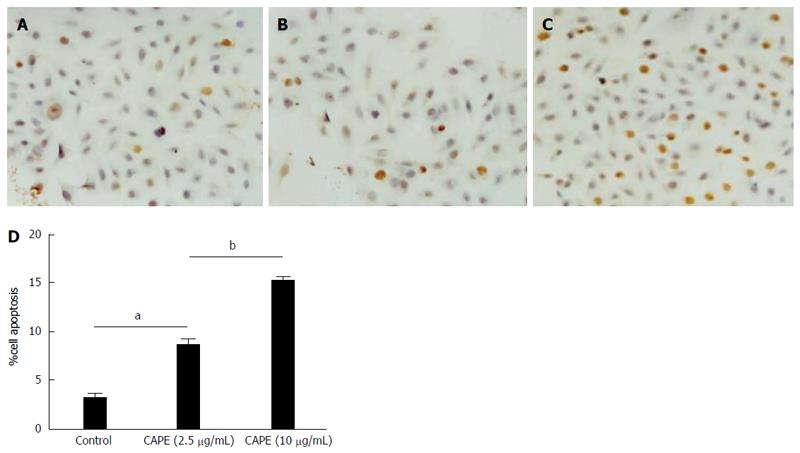
Figure 1 Caffeic acid phenethyl ester induces colorectal cancer cell apoptosis.
SW480 cells were treated with caffeic acid phenethyl ester (CAPE) in 24-well plates. For TUNEL staining, cells were treated without (A), with 2.5 μg/mL (B), or 10 μg/mL (C) CAPE for 48 h and cell apoptosis was examined using the TUNEL detection kit. Cell apoptosis was determined by counting TUNEL positive cells under a light microscope at × 40 objective (D). Results are representative of 3 independent experiments with similar results. aP < 0.05 vs controls; bP < 0.01, CAPE (2.5 μg/mL) vs CAPE (10 μg/mL).
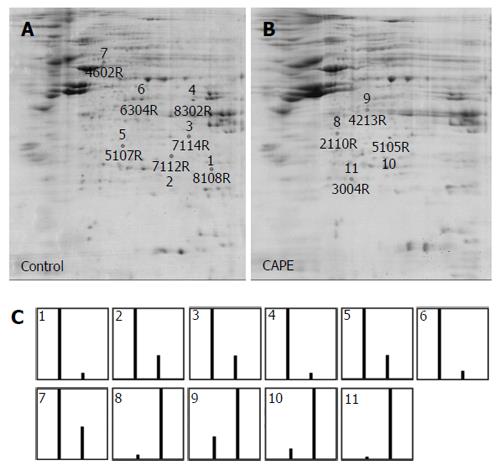
Figure 2 Protein profiles of SW480 cells treated with caffeic acid phenethyl ester by two-dimensional PAGE.
SW480 cells were treated without (A) or with (B) 10 μg/mL caffeic acid phenethyl ester (CAPE) for 48 h and then harvested for 2D-PAGE analysis. 500 mg of cellular protein was applied to the IEF gel. After electrophoresis, the gels were stained with Coomassie brilliant blue R-250 and the proteins were analysed by PDQuest 2-D analysis software. The marked spots shown on the gels were the down-regulated proteins (shown by numbers 1-7) and the up-regulated proteins (shown by numbers 8-11). The relative abundance of each differentially expressed protein in the 2 gels was analysed by PDQuest (C). The first bar shown in the graph is the relative abundance of the proteins in untreated cells and the second bar is the relative abundance of the proteins in CAPE-treated cells. Results are representative of 3 independent experiments with similar results.
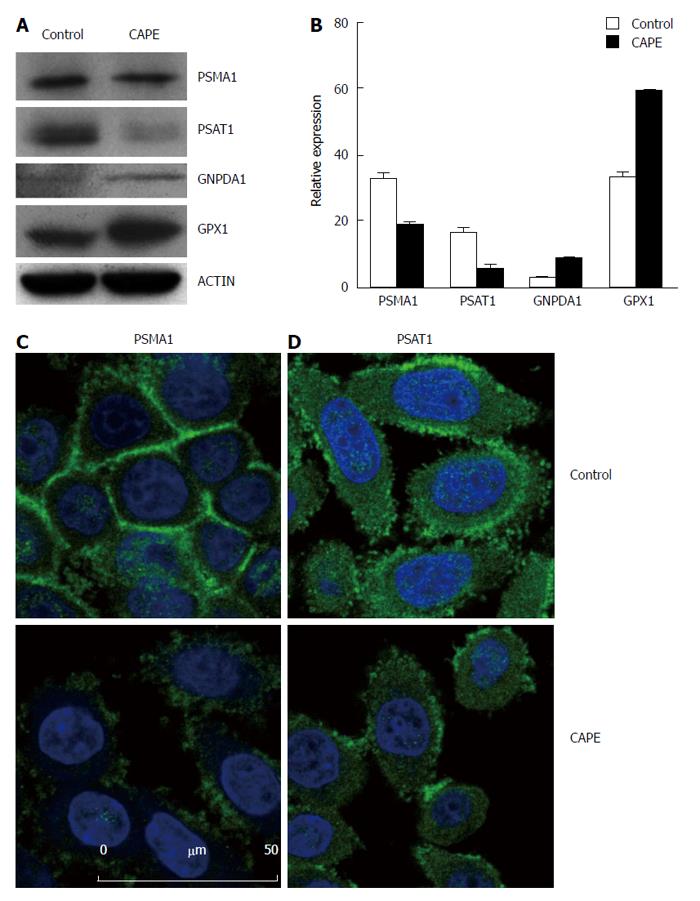
Figure 3 Validation of differentially expressed proteins in SW480 treated with caffeic acid phenethyl ester.
SW480 cells were treated without (control) and with 10 μg/mL CAPE for 48 h and then harvested for Western blotting (A and B) or immunofluorescence assay (C and D). For Western blotting, beta-actin was included as the internal control. Densitometric analysis was performed and the integrated density values are presented as the ratio of each protein over the beta-actin protein (B). For the immunofluorescence assay, SW480 cells were grown on glass coverslips and treated without (control) or with CAPE (10 μg/mL) for 48 h. The cells were washed with PBS and fixed with methanol. Anti-PSMA1 (A), and anti-PSAT1 (B) monoclonal antibodies were applied as the primary antibodies, and then, FITC-conjugated secondary antibodies were used. DAPI was used to stain the nucleus. Results are representative of 2 independent experiments with similar results. PSMA1: Proteasome subunit alpha 1; PSAT1: Phosphoserine aminotransferase 1.
- Citation: He YJ, Li WL, Liu BH, Dong H, Mou ZR, Wu YZ. Identification of differential proteins in colorectal cancer cells treated with caffeic acid phenethyl ester. World J Gastroenterol 2014; 20(33): 11840-11849
- URL: https://www.wjgnet.com/1007-9327/full/v20/i33/11840.htm
- DOI: https://dx.doi.org/10.3748/wjg.v20.i33.11840


