Copyright
©2014 Baishideng Publishing Group Inc.
World J Gastroenterol. Aug 28, 2014; 20(32): 11287-11296
Published online Aug 28, 2014. doi: 10.3748/wjg.v20.i32.11287
Published online Aug 28, 2014. doi: 10.3748/wjg.v20.i32.11287
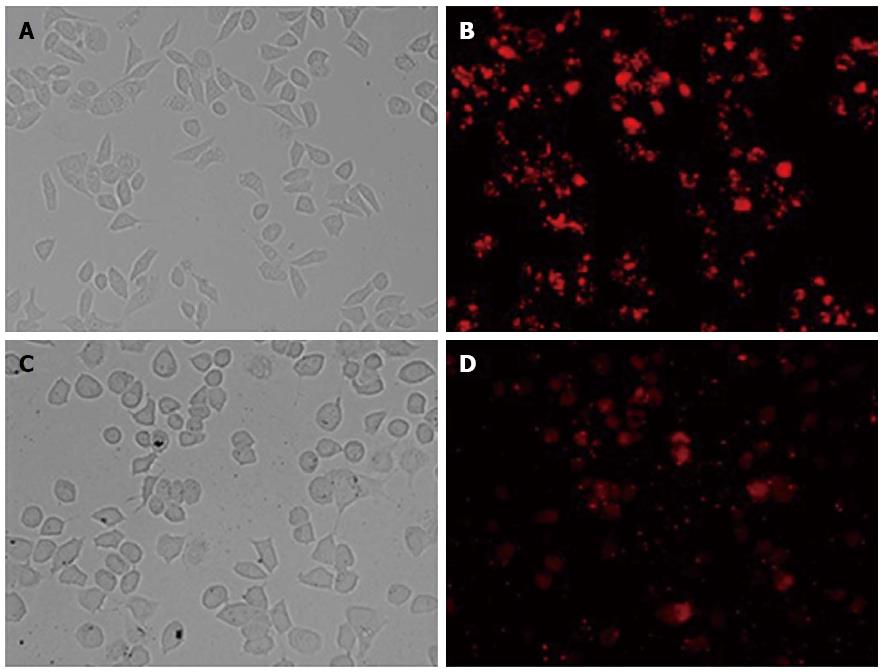
Figure 1 BLOCK-iT Alexa Fluor red fluorescent control.
The BLOCK-iT Alexa Fluor red fluorescent control (30 nmol/L) was transfected into Hep G2 and Bel7402 cells using Lipofectamine RNAi MAX Transfection Reagent. Twenty-four hours after transfection, growth medium was removed and replaced with PBS. Hep G2 and Bel7402 cell localization of the Alexa Fluor Red Fluorescent control oligo is seen with fluorescent microscopy (B and D, × 200). Over 80% of the cells took up the control oligo and retained a normal morphology, as seen in bright field (A and C, × 200).
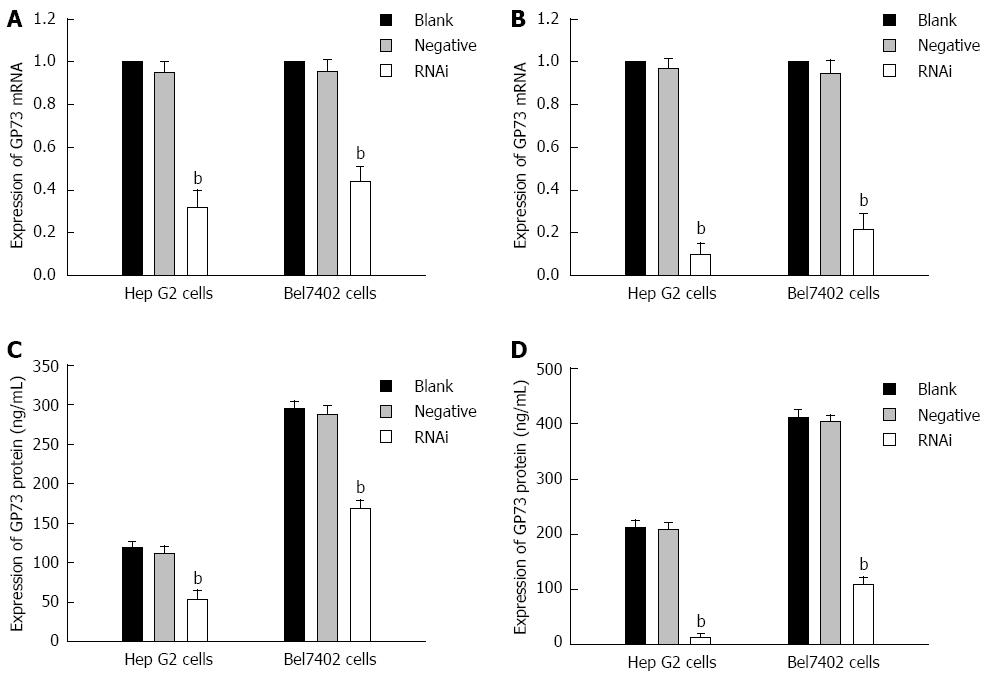
Figure 2 Expression of GP73 mRNA and protein for Hep G2 and Bel7402 cells after transfection with Stealth RNAi against GP73, negative control RNAi or blank control.
A: Relative expression of GP73 mRNA level at 24 h after transfection analyzed by quantitative real-time reverse transcription polymerase chain reaction (RT-PCR); B: Relative expression of GP73 mRNA level at 48 h after transfection analyzed by quantitative RT-PCR; C: Expression of GP73 proteins in supernatant of Hep G2 and Bel7402 cells were detected by enzyme-linked immunosorbent assay (ELISA) at 24 and 48 h; D: Expression of GP73 proteins in supernatant of Hep G2 and Bel7402 cells was detected by ELISA at 48 h. The corresponding values of GP73 protein in the three groups at 24 and 48 h after transfection. bP < 0.01 vs blank group.
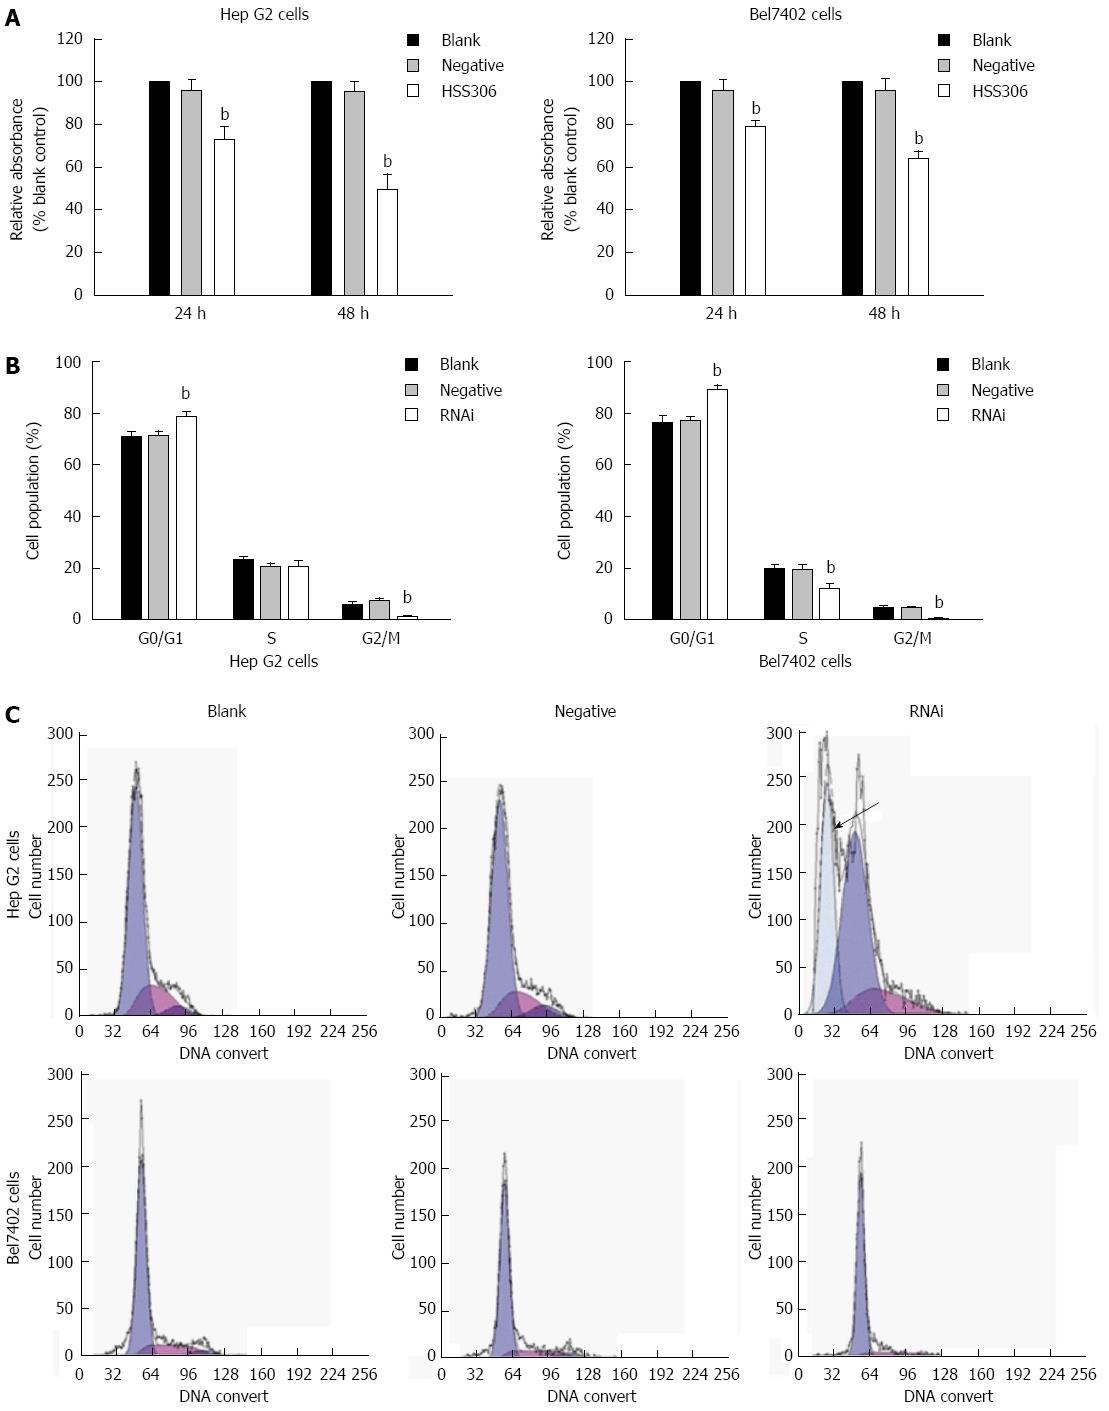
Figure 3 Silencing of GP73 gene decreased cell proliferation.
A: MTT analysis at 24 and 48 h (% blank control) for Hep G2 and Bel7402 cells; B: Cell cycle assay was analyzed by flow cytometry; C: Flow cytometric analysis of the cell cycle distribution of Hep G2 and Bel7402 cells at 24 h after transfection. Cells were washed, fixed, and stained with propidium iodide, and analyzed using Beckman-Coulter Epics flow cytometer. bP < 0.01 vs blank group.
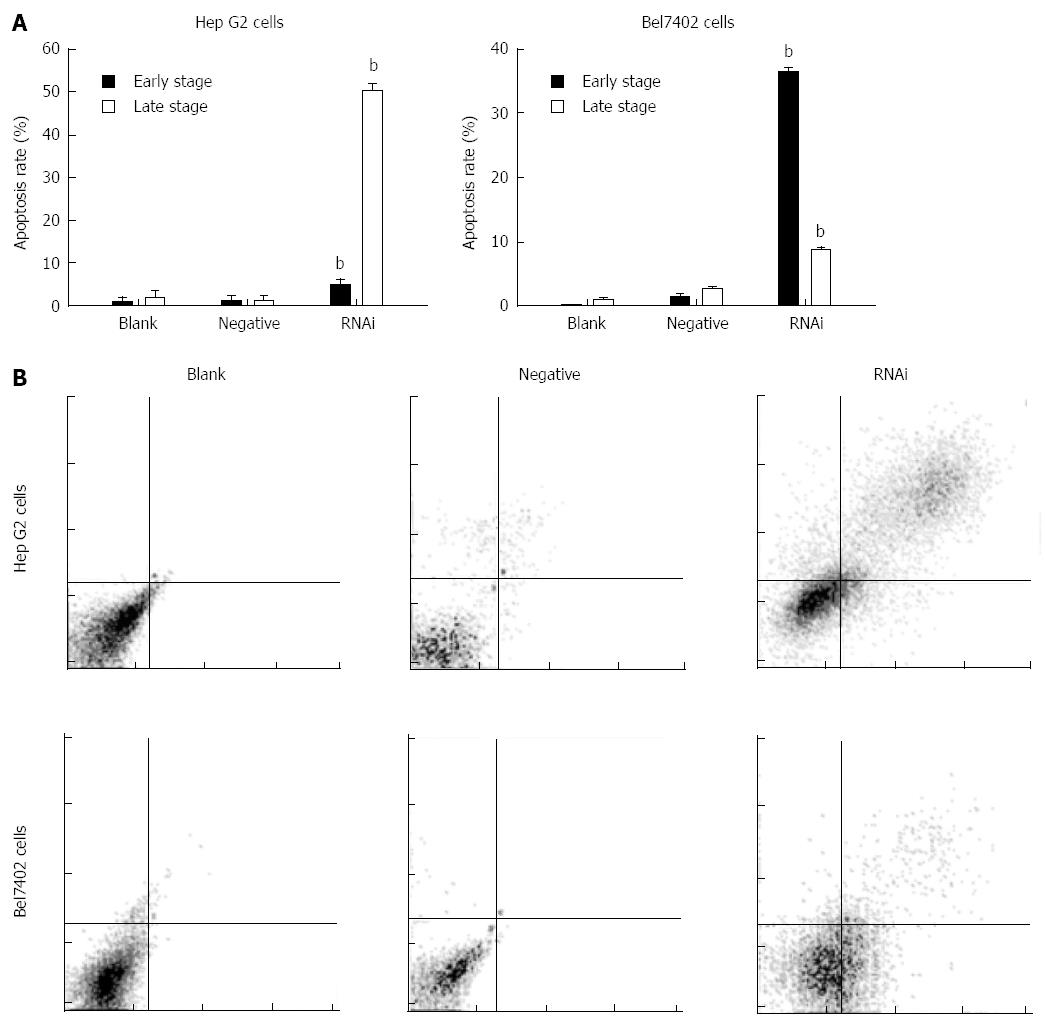
Figure 4 Effect of GP73-targeted stealth RNAi transfection on apoptosis of Hep G2 and Bel7402 cells.
A: Apoptosis assay was analyzed by flow cytometry; B: Apoptotic effect of Stealth RNAi after 48 h, and later stained with annexin V-FITC and PI. The stained cells were analyzed for apoptosis using a Beckman-Coulter Epics flow cytometer. bP < 0.01 vs blank group.
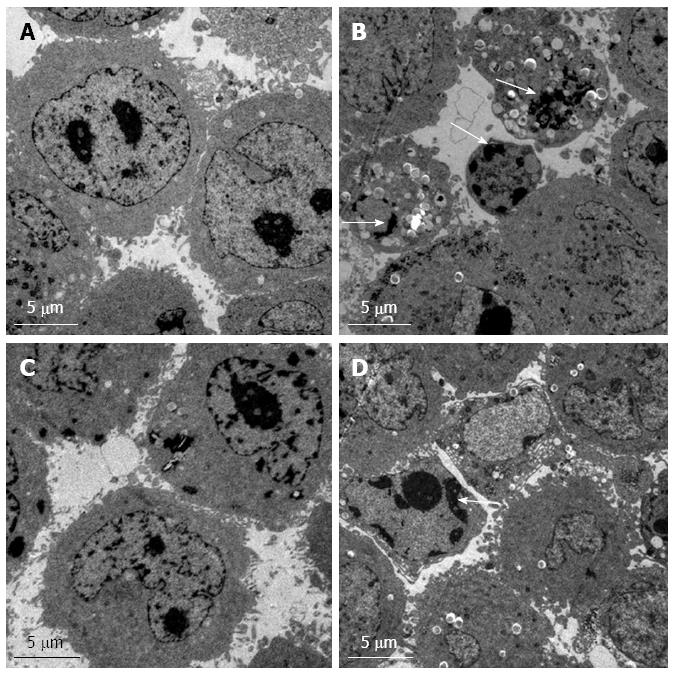
Figure 5 Transmission electron microscopy.
The ultrastructural morphology of control (A) and RNAi (B) of Hep G2 cells. The ultrastructural morphology of control (C) and RNAi (D) Bel7402 cells. Nuclear fragmentation and apoptotic bodies are indicated by arrows.
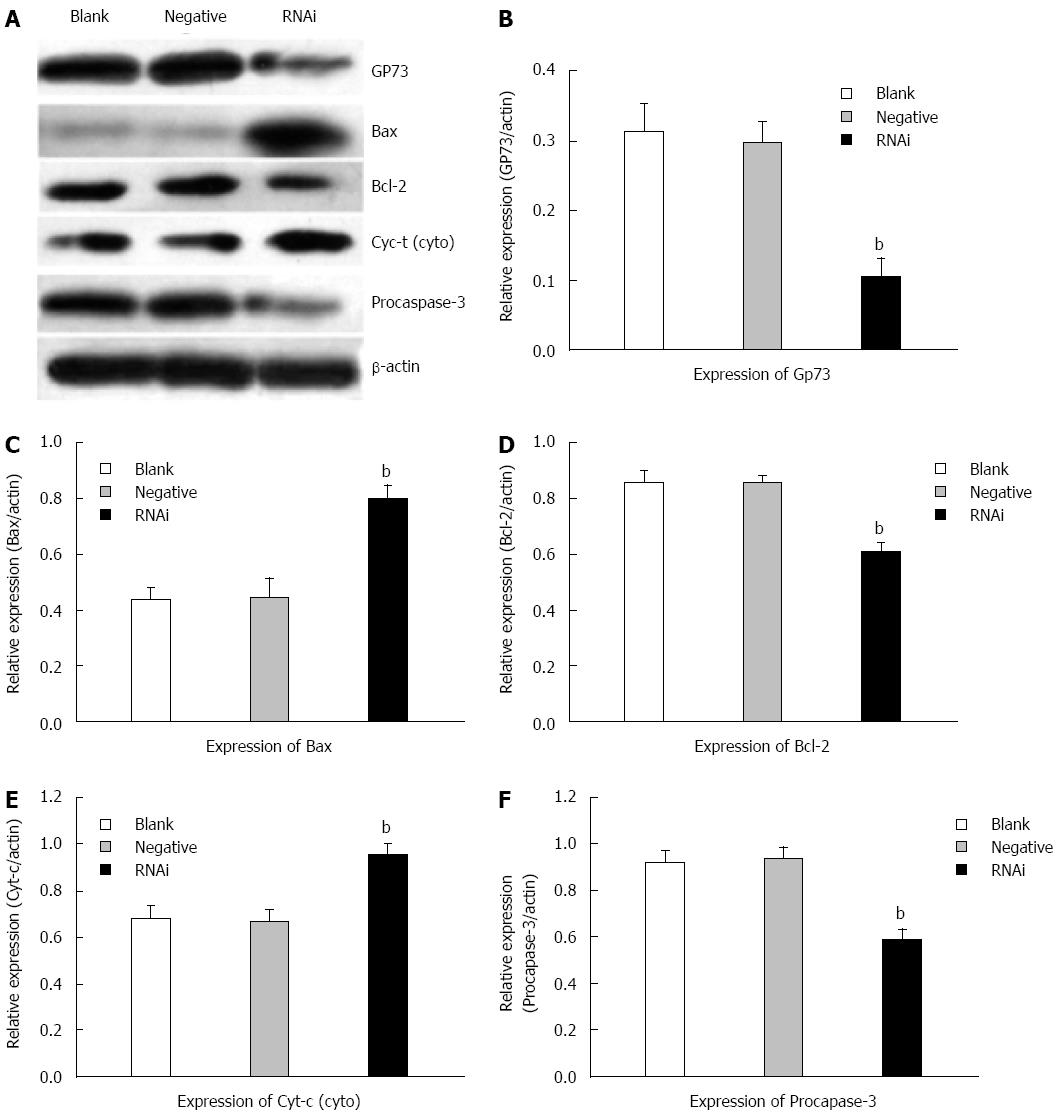
Figure 6 Effects of silencing GP73 gene on apoptosis-related molecules in Hep G2 cells.
A: Western blotting detected expression of GP73, Bcl-2, Bax, cytochrome c and procaspase-3 in Hep G2 cells at 48 h after transfection with Stealth RNAi (HSS181966; Stealth RNAi against GP73, negative control RNAi) or blank control; B-F: Representative immunoblots are shown from three independent experiments. Software Glyko Bandscan 5.0 was used to quantify the bands, and the expression of β-actin was used as a loading control, the protein levels were normalized against β-actin, data were expressed as mean ± SD (bP < 0.01 vs blank group).
-
Citation: Zhang YL, Zhang YC, Han W, Li YM, Wang GN, Yuan S, Wei FX, Wang JF, Jiang JJ, Zhang YW. Effect of
GP73 silencing on proliferation and apoptosis in hepatocellular cancer. World J Gastroenterol 2014; 20(32): 11287-11296 - URL: https://www.wjgnet.com/1007-9327/full/v20/i32/11287.htm
- DOI: https://dx.doi.org/10.3748/wjg.v20.i32.11287


