Copyright
©2014 Baishideng Publishing Group Inc.
World J Gastroenterol. Aug 28, 2014; 20(32): 11160-11181
Published online Aug 28, 2014. doi: 10.3748/wjg.v20.i32.11160
Published online Aug 28, 2014. doi: 10.3748/wjg.v20.i32.11160
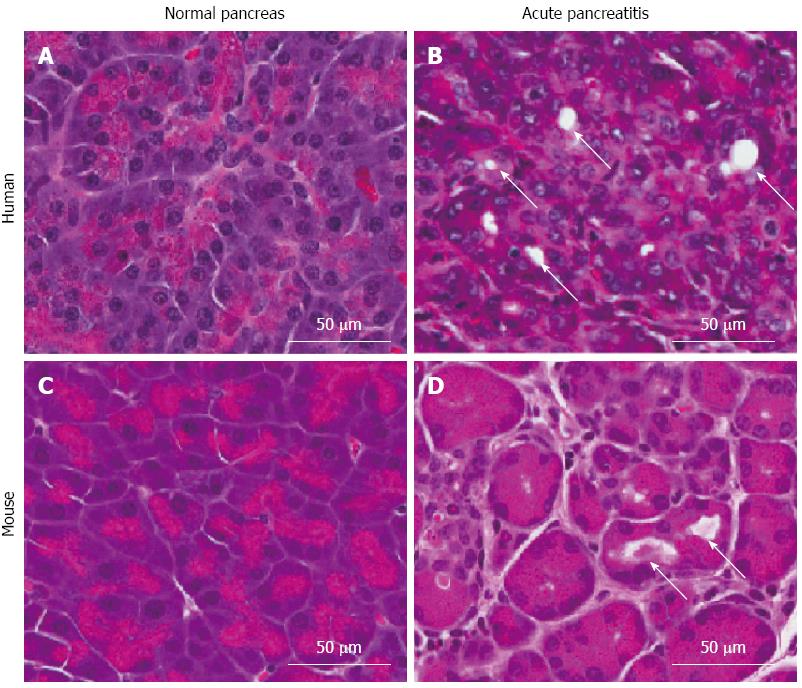
Figure 1 Comparison of histology of human and mouse pancreatic tissue.
A: Normal human pancreas; B: Human acute pancreatitis (AP); C: Normal mouse pancreas; D: Mouse AP. Arrows indicate acini with dilated lumina, as commonly seen in AP.
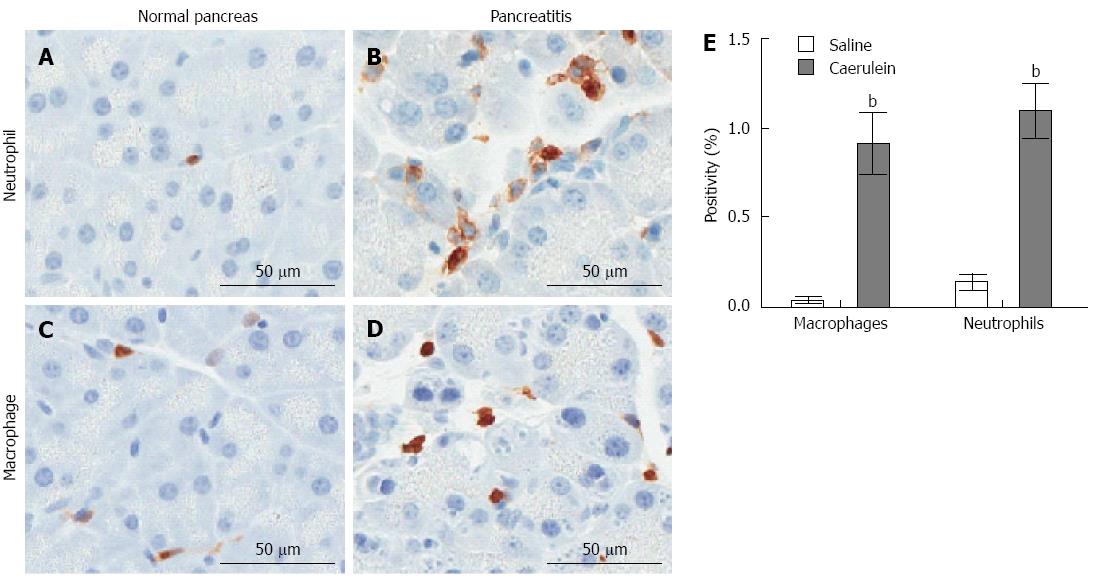
Figure 2 Induction of innate immune response in a mouse model of acute pancreatitis.
Mice were injected intraperitoneally with 50 μg/kg caerulein or saline hourly for 7 h (Mayo Clinic IACUC protocol A48510). The pancreas was isolated one hour following the last injection and analyzed immunohistochemically for the presence of neutrophils (Ly6B.2: AbSerotec) or macrophages (Mac-2; Cedarlane Diagnostics). A: Neutrophil infiltration in saline-treated mice; B: Neutrophil infiltration in caerulein-treated mice; C: Macrophage infiltration in saline-treated mice; D: Macrophage infiltration in cearulein-treated mice; E: Stained slides were imaged using ScanScope XT (Aperio, Vista, California) and immunohistochemical staining was quantified using the Aperio ImageScope reader. Mean ± SD is plotted for each group of n≥ 4 mice, bP < 0.01 vs saline group.
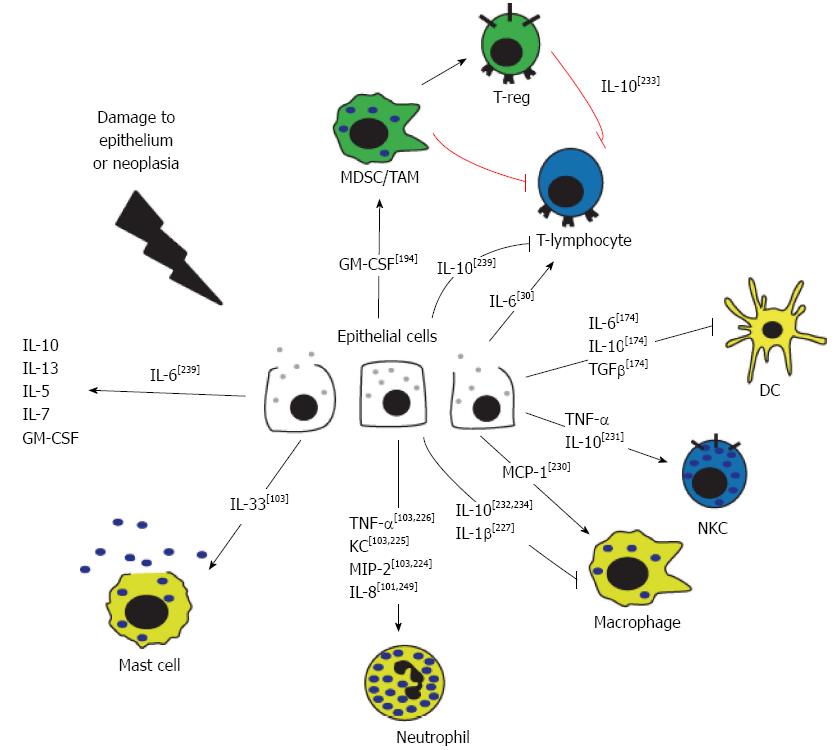
Figure 3 Cytokine signaling in the pancreatic epithelium.
In response to damage or disease, the pancreatic epithelial cells release cytokines and chemokines. Activated immune cells secrete numerous chemotactic factors in response to, and in addition to, those secreted by the epithelial cells. TNF: Tumor necrosis factor; IL: Interleukin; MDSC: Myeloid-derived suppressor cells; TAM: Tumor-associated macrophage.
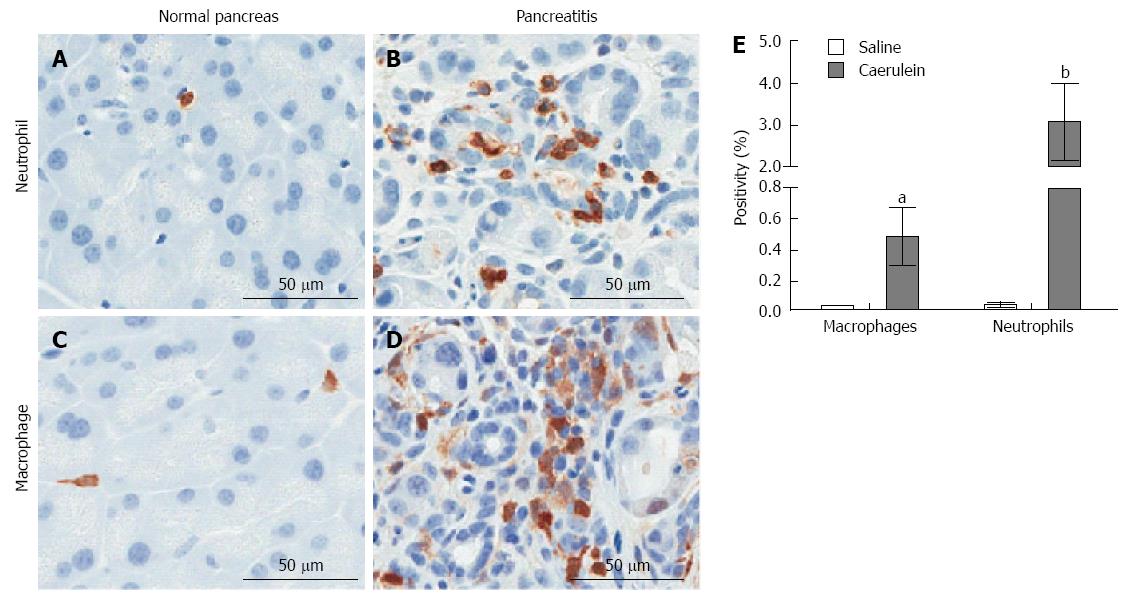
Figure 4 Induction of innate immune response in a mouse model of chronic pancreatitis.
Mice were injected intraperatoneally with 250 μg/kg caerulein or saline twice daily, six days per week for two weeks (Mayo Clinic IACUC protocol A48510). The pancreas was isolated 24 h following the last injection and analyzed immunohistochemically for the presence of neutrophils (Ly6B.2: AbSerotec) or macrophages (Mac-2; Cedarlane Diagnostics). A: Neutrophil infiltration in saline-treated mice; B: Neutrophil infiltration in caerulein-treated mice; C: Macrophage infiltration in saline-treated mice; D: Macrophage infiltration in cearulein-treated mice; E: Stained slides were imaged using ScanScope XT (Aperio, Vista, California) and staining was quantified using the Aperio ImageScope reader. aP < 0.05, bP < 0.01 vs corresponding saline treated control. Mean ± SD is plotted for each group of n≥ 5 mice.
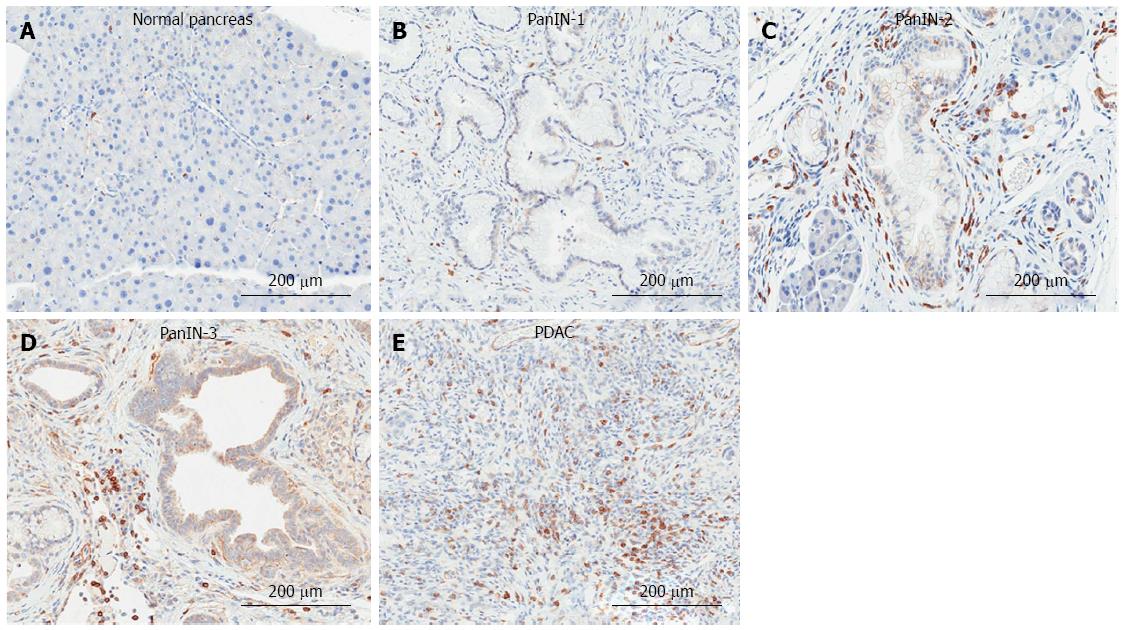
Figure 5 Immunohistochemical detection of T-lymphocytes in the KrasG12D-induced mouse model of pancreatic ductal adenocarcinoma.
A: Normal pancreas; B: Pancreatic intraepithelial neoplasia (PanIN)-1; C: PanIN-2; D: PanIN-3; E: Pancreatic ductal adenocarcinoma (PDAC) tissue was analyzed by immunohistochemistry for the presence of T-lymphocytes (CD3: abcam).
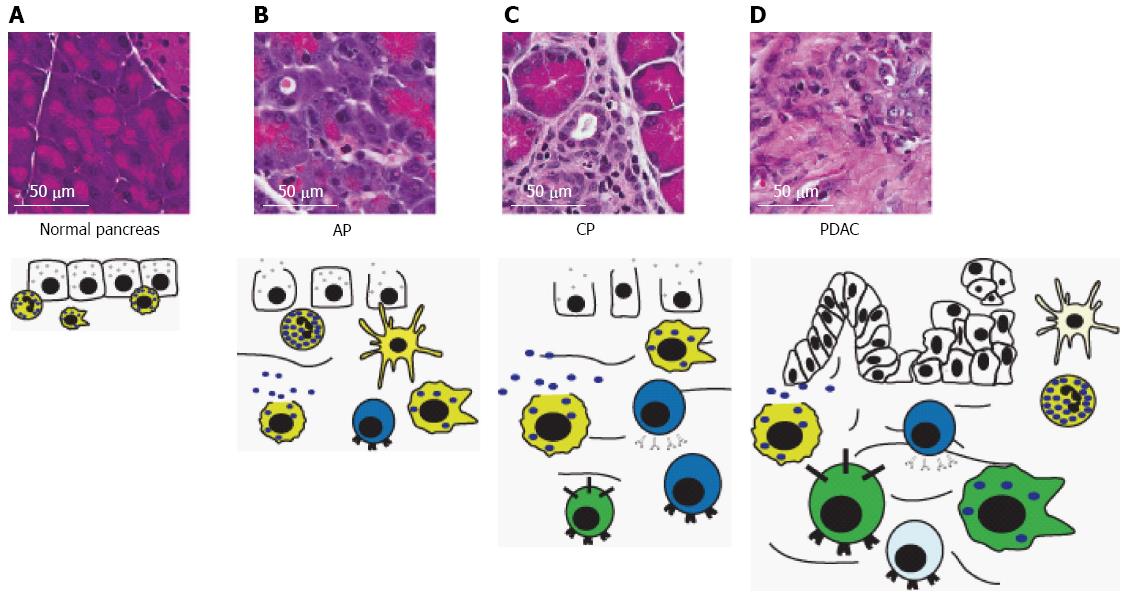
Figure 6 Immune cells in progressive pancreatic disease.
A: The normal pancreas contains sparse, mostly innate, inflammatory cells and lacks the dense stroma typically seen in chronic pancreatitis (CP) and pancreatic ductal adenocarcinoma (PDAC); B: Acute pancreatitis (AP) is characterized by acinar degranulation, edema and recruitment of mostly innate inflammatory cells, but also some T-lymphocytes in response to acinar damage. Pancreatic mast cells begin to degranulate; C: CP is characterized by development of stroma surrounding degranulated acinar cells, acinar-to-ductal metaplasia and edema. Additionally, there is an increased presence of macrophages, and T- and B-lymphocytes, and further degranulation of mast cells; D: Development of pancreatic intraepithelial neoplasias and subsequent PDAC leads to a significant increase in immunosuppressive cell types including tumor-associated macrophages, myeloid-derived suppressor cells, and Tregs. Degranulated mast cells, neutrophils, dendritic cells and B- and T-lymphocytes are also present. However, T-lymphocytes and dendritic cells are typically inhibited and defective, respectively. Size of immune cell represents relative abundance. Cell color denotes immune cell type: yellow, innate immune cells; blue, adaptive immune cells; green, immunosuppressive cells. For description of graphical representation of cell types, see Figure 3 legend. Cells that are inactivated or defective are represented by a lighter color.
- Citation: Inman KS, Francis AA, Murray NR. Complex role for the immune system in initiation and progression of pancreatic cancer. World J Gastroenterol 2014; 20(32): 11160-11181
- URL: https://www.wjgnet.com/1007-9327/full/v20/i32/11160.htm
- DOI: https://dx.doi.org/10.3748/wjg.v20.i32.11160


