Copyright
©2014 Baishideng Publishing Group Inc.
World J Gastroenterol. Aug 28, 2014; 20(32): 11131-11141
Published online Aug 28, 2014. doi: 10.3748/wjg.v20.i32.11131
Published online Aug 28, 2014. doi: 10.3748/wjg.v20.i32.11131
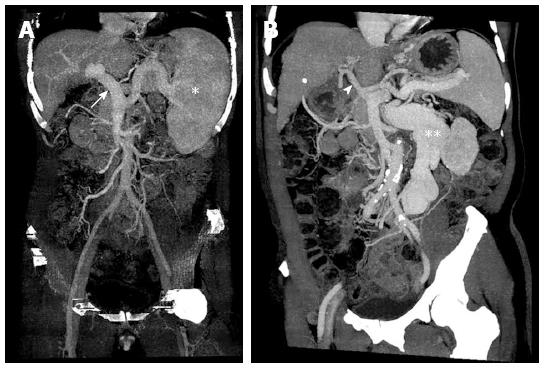
Figure 1 Hepatic and splanchnic vasculature at the time of transplantation in cirrhotic patients.
A: Portal vein engorgement (white arrow) and splenomegaly (white astrocyte) without remarkable collateral formation; B: Shrinkage of portal vein (white arrowhead) with massive collateralization (white double astrocytes).
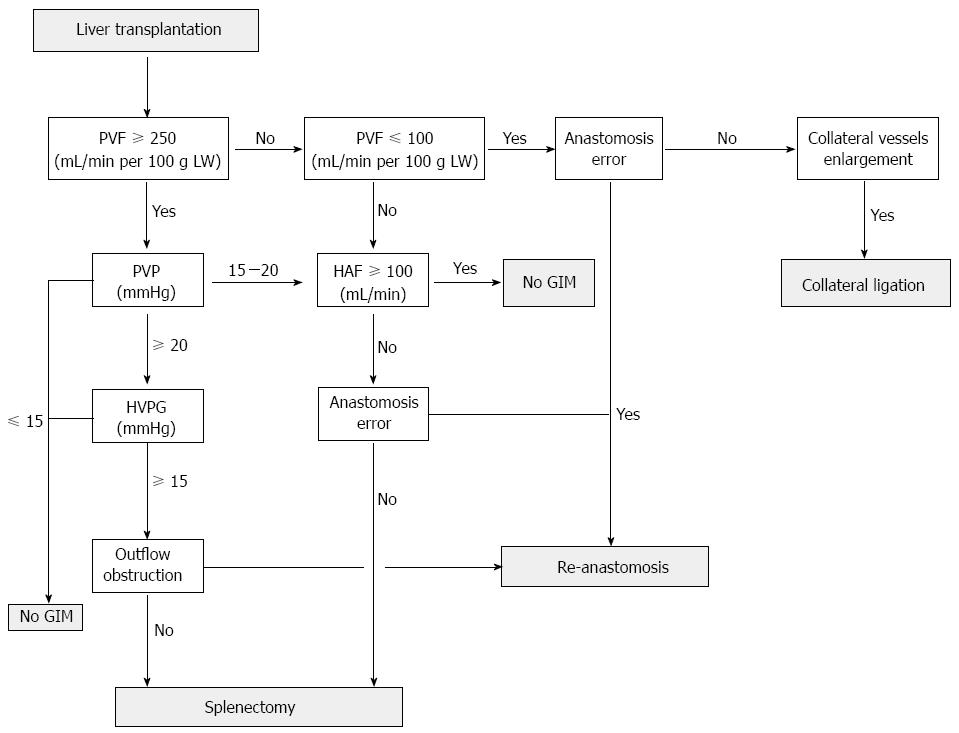
Figure 2 Flowchart applied in our center for performing graft inflow modulation according to systemic and hepatic hemodynamic parameters in transplant patients with portal hyperperfusion.
Technical errors such as hepatic outflow obstruction, hepatic artery kinking, or anastomosis failure should be evaluated repeatedly. After graft inflow modulation (GIM) is performed, the portal vein flow (PVF), portal vein pressure (PVP), and central venous pressure should be re-measured to ensure optimal portal inflow. HAF: Hepatic artery flow; HVPG: Hepatic venous pressure gradient; LW: Liver weight.
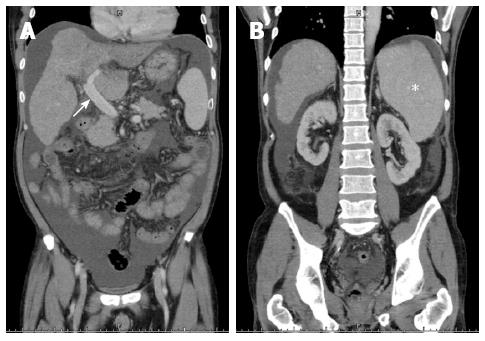
Figure 3 Preoperative computed tomographic findings of case 1.
A: Engorged portal vein of 1.8 cm in diameter (white arrow); B: Splenomegaly with 15.4 cm at the longest axis without remarkable collaterals (white asterisk).
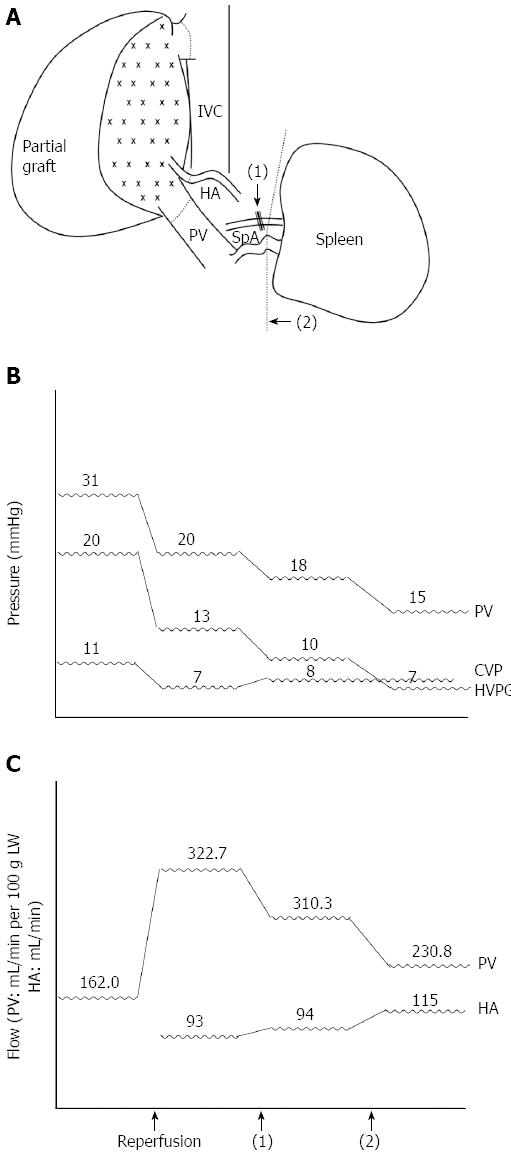
Figure 4 Sequential graft inflow modulation of case 1.
A: Splenic artery ligation [black arrow, (1)] followed with splenectomy [black arrow head, (2)]; B: Sequential changes of the portal vein (PV) pressure, central venous pressure (CVP), and hepatic venous pressure gradient (HVPG) during liver transplantation pre- and post-GIM; C: Sequential changes of the portal vein flow (mL/min per 100 g of LW) and hepatic artery (HA) flow (mL/min). IVC: Inferior vena cava; SpA: Splenic artery.
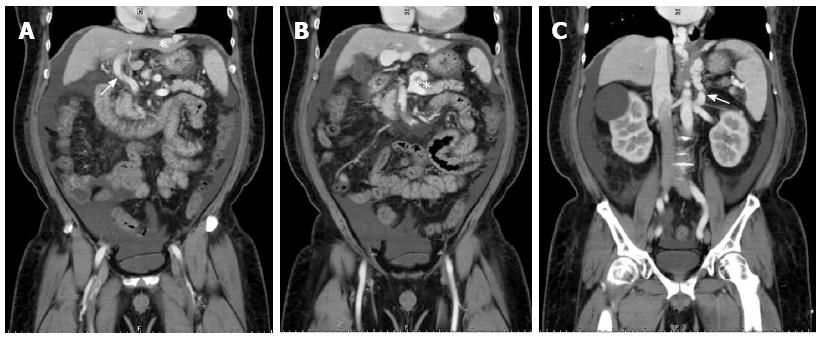
Figure 5 Preoperative computed tomographic findings of case 2.
A: The right lobe portal vein could not be identified, likely owing to hepatofugal flow-induced stasis and thrombosis (white arrowhead) and portal-systemic shunting from the left portal vein to the left pericardiac-phrenic vein (white asterisk); B: Coronary vein engorgement (double white asterisks); C: Spontaneous splenorenal shunting was also noted (white arrow).
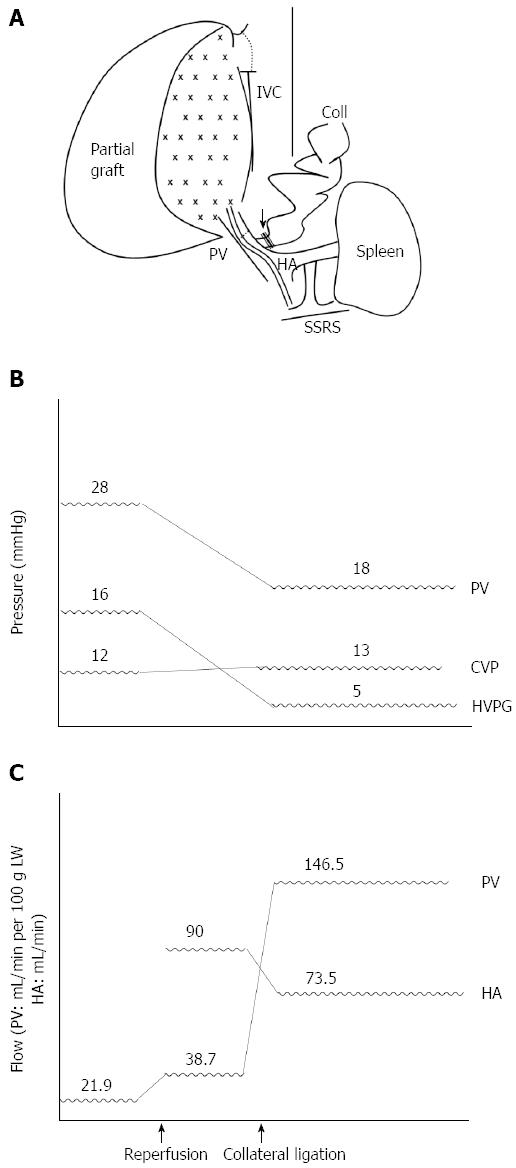
Figure 6 Sequential graft inflow modulation of case 2.
A: After transplantation with a right-lobe graft, hypoperfusion was noted and coronary vein ligation was performed immediately (black arrow); B: Sequential changes of the portal vein (PV) pressure, central venous pressure (CVP), and hepatic venous pressure gradient (HVPG) during liver transplantation pre- and post-coronary vein ligation; C: Sequential changes of the portal vein flow (mL/min per 100 g of LW) and hepatic artery flow (mL/min). Coll: Collateral; HA: Hepatic artery; IVC: Inferior vena cava; SSRS: Spontaneous splenorenal shunt.
- Citation: Feng AC, Fan HL, Chen TW, Hsieh CB. Hepatic hemodynamic changes during liver transplantation: A review. World J Gastroenterol 2014; 20(32): 11131-11141
- URL: https://www.wjgnet.com/1007-9327/full/v20/i32/11131.htm
- DOI: https://dx.doi.org/10.3748/wjg.v20.i32.11131


