Copyright
©2014 Baishideng Publishing Group Co.
World J Gastroenterol. May 14, 2014; 20(18): 5505-5510
Published online May 14, 2014. doi: 10.3748/wjg.v20.i18.5505
Published online May 14, 2014. doi: 10.3748/wjg.v20.i18.5505
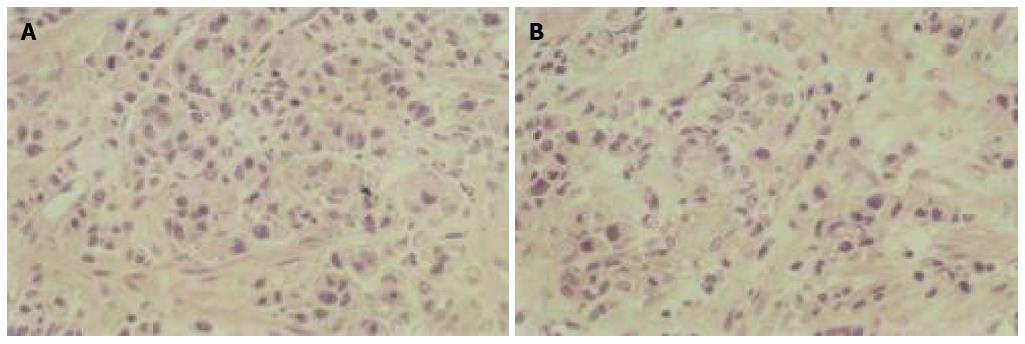
Figure 1 Morphology of apoptotic cells in gastrointestinal cancer seen under light microscopy.
The number of apoptotic cells increased following a 3-d period of As2O3 treatment. Typical apoptotic changes were seen in GIC cells after As2O3 treatment, including cellular shrinkage, cell nucleus fragmentation, chromatin condensation, and the appearance of apoptotic bodies. A: Before As2O3 treatment; B: After As2O3 treatment (HE × 40).
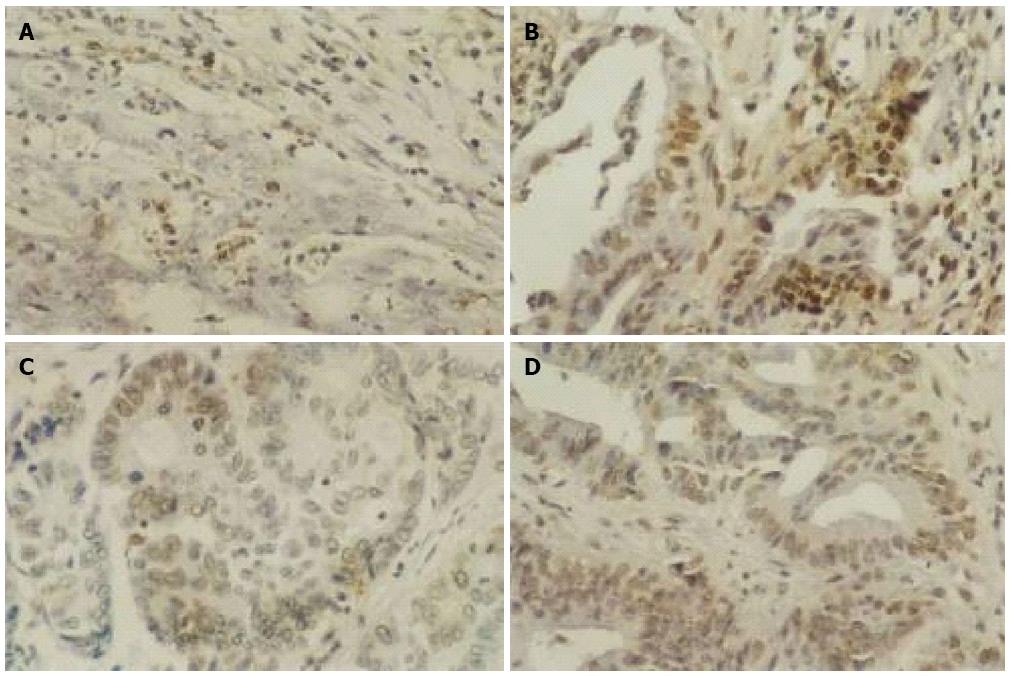
Figure 2 Human gastrointestinal cancer cells were observed by transferase dUTP nick end labelling assay, and identified by brown-stained nuclei.
The number of apoptotic cells was counted in order to calculate the apoptotic index. A: Gastric cancer before As2O3 treatment; B: Gastric cancer after As2O3 treatment: C: Colon cancer before As2O3 treatment; D: Colon cancer after As2O3 treatment (× 400).
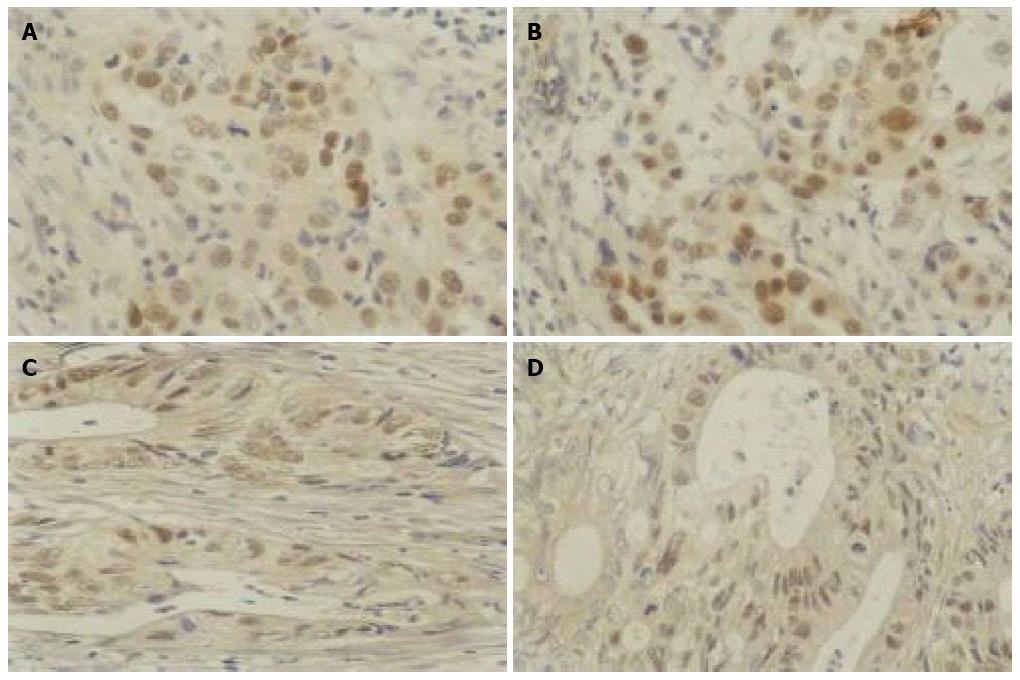
Figure 3 p53 protein expression in human gastrointestinal cancer cells as indicated by brown-stained nuclei.
A: Gastric cancer before As2O3 treatment; B: Gastric cancer after As2O3 treatment; C: Colon cancer before As2O3 treatment; D: Colon cancer after As2O3 treatment (× 400).
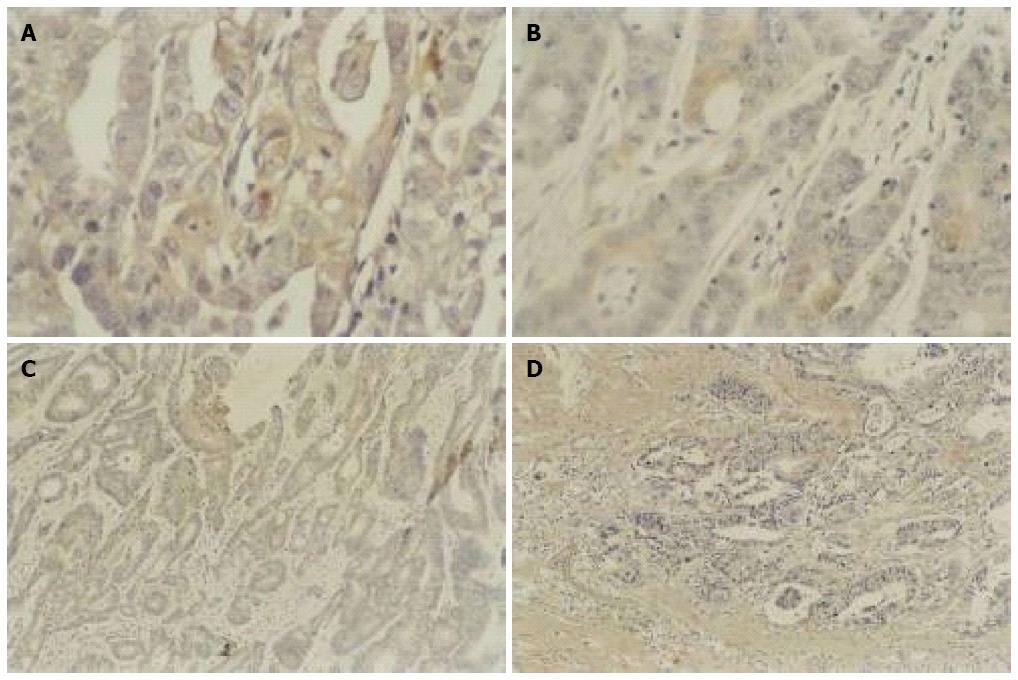
Figure 4 Bcl-2 protein expression in human gastrointestinal cancer cells as indicated by brown-stained cytoplasm.
A: Gastric cancer before As2O3 treatment; B: Gastric cancer after As2O3 treatment; C: Colon cancer before As2O3 treatment; D: Colon cancer after As2O3 treatment (× 400).
Figure 5 Linear correlation analyses between apoptotic index and Bcl-2 expression in gastric cancer (A) and colon cancer (B) (%).
Data are given as mean ± SD. No significant correlation was detected.
- Citation: Ma ZB, Xu HY, Jiang M, Yang YL, Liu LX, Li YH. Arsenic trioxide induces apoptosis of human gastrointestinal cancer cells. World J Gastroenterol 2014; 20(18): 5505-5510
- URL: https://www.wjgnet.com/1007-9327/full/v20/i18/5505.htm
- DOI: https://dx.doi.org/10.3748/wjg.v20.i18.5505


