Copyright
©2014 Baishideng Publishing Group Co.
World J Gastroenterol. Apr 28, 2014; 20(16): 4702-4711
Published online Apr 28, 2014. doi: 10.3748/wjg.v20.i16.4702
Published online Apr 28, 2014. doi: 10.3748/wjg.v20.i16.4702
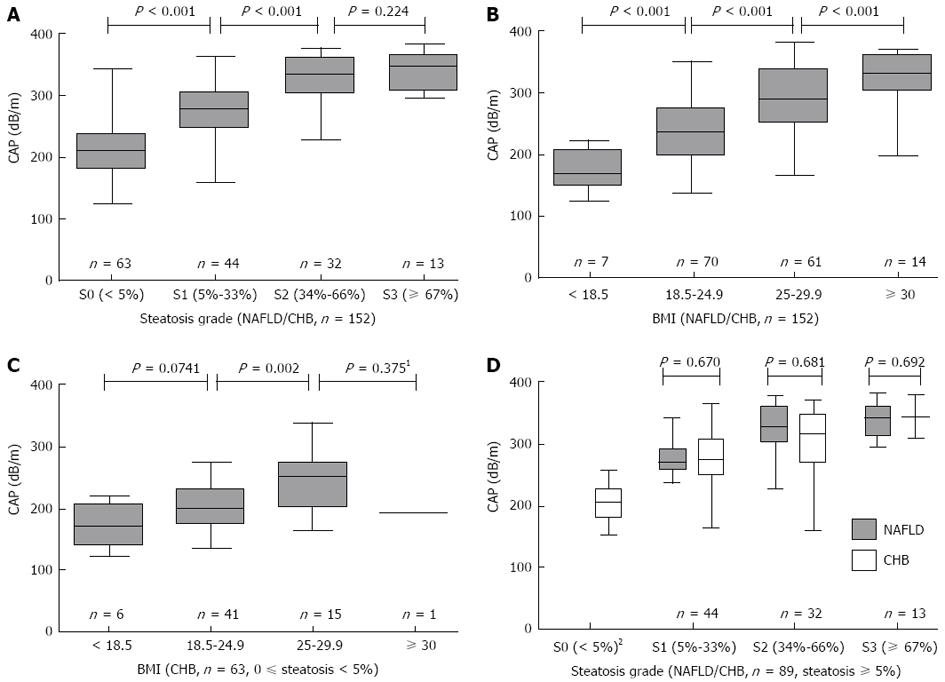
Figure 1 Controlled attenuation parameter distribution for different steatosis grades or body mass index levels.
A: Controlled attenuation parameter distribution in patients with different steatosis grades (n = 152); B: CAP distribution in patients with different BMI levels (n = 152); C: CAP distribution in patients with BMI levels with either no steatosis or steatosis less than 5% (n = 63); D: CAP between NAFLD and CHB patients with the same degree of fatty deposition (n = 89). 1Fisher’s exact test was used; 2No NAFLD patients in S0. CAP: Controlled attenuation parameter; BMI: Body mass index; NAFLD: Non-alcoholic fatty liver disease; CHB: Chronic hepatitis B.
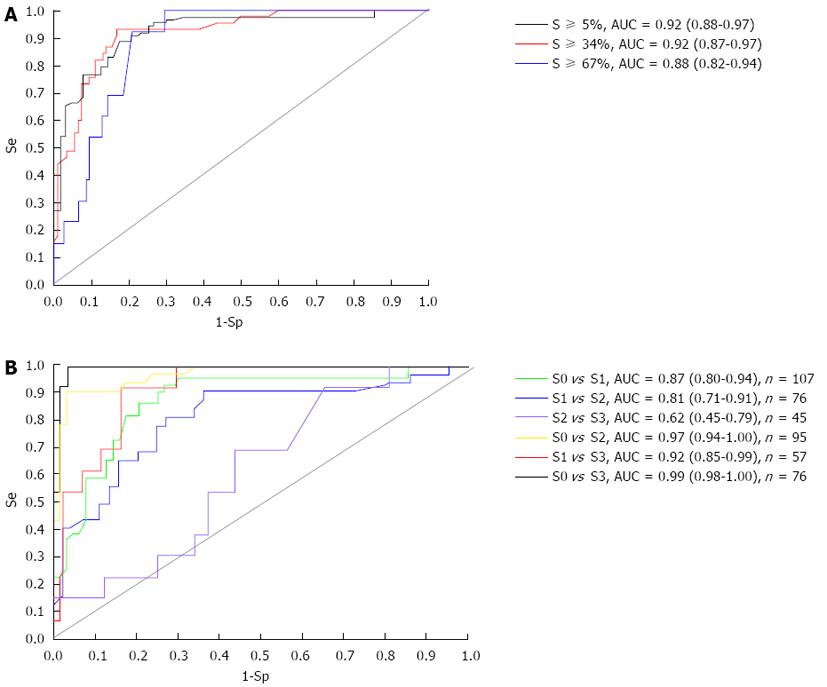
Figure 2 Receiver operating characteristic curves.
A: Receiver operating characteristic curve for controlled attenuation parameter in the diagnosis of hepatic steatosis ≥ 5%, ≥ 34% and ≥ 67%; B: Receiver operating characteristic curves and area under the curves (AUCs) between two steatosis grades. Se: sensitivity; Sp: specificity.
- Citation: Shen F, Zheng RD, Mi YQ, Wang XY, Pan Q, Chen GY, Cao HX, Chen ML, Xu L, Chen JN, Cao Y, Zhang RN, Xu LM, Fan JG. Controlled attenuation parameter for non-invasive assessment of hepatic steatosis in Chinese patients. World J Gastroenterol 2014; 20(16): 4702-4711
- URL: https://www.wjgnet.com/1007-9327/full/v20/i16/4702.htm
- DOI: https://dx.doi.org/10.3748/wjg.v20.i16.4702


