Copyright
©2014 Baishideng Publishing Group Co.
World J Gastroenterol. Apr 28, 2014; 20(16): 4636-4647
Published online Apr 28, 2014. doi: 10.3748/wjg.v20.i16.4636
Published online Apr 28, 2014. doi: 10.3748/wjg.v20.i16.4636
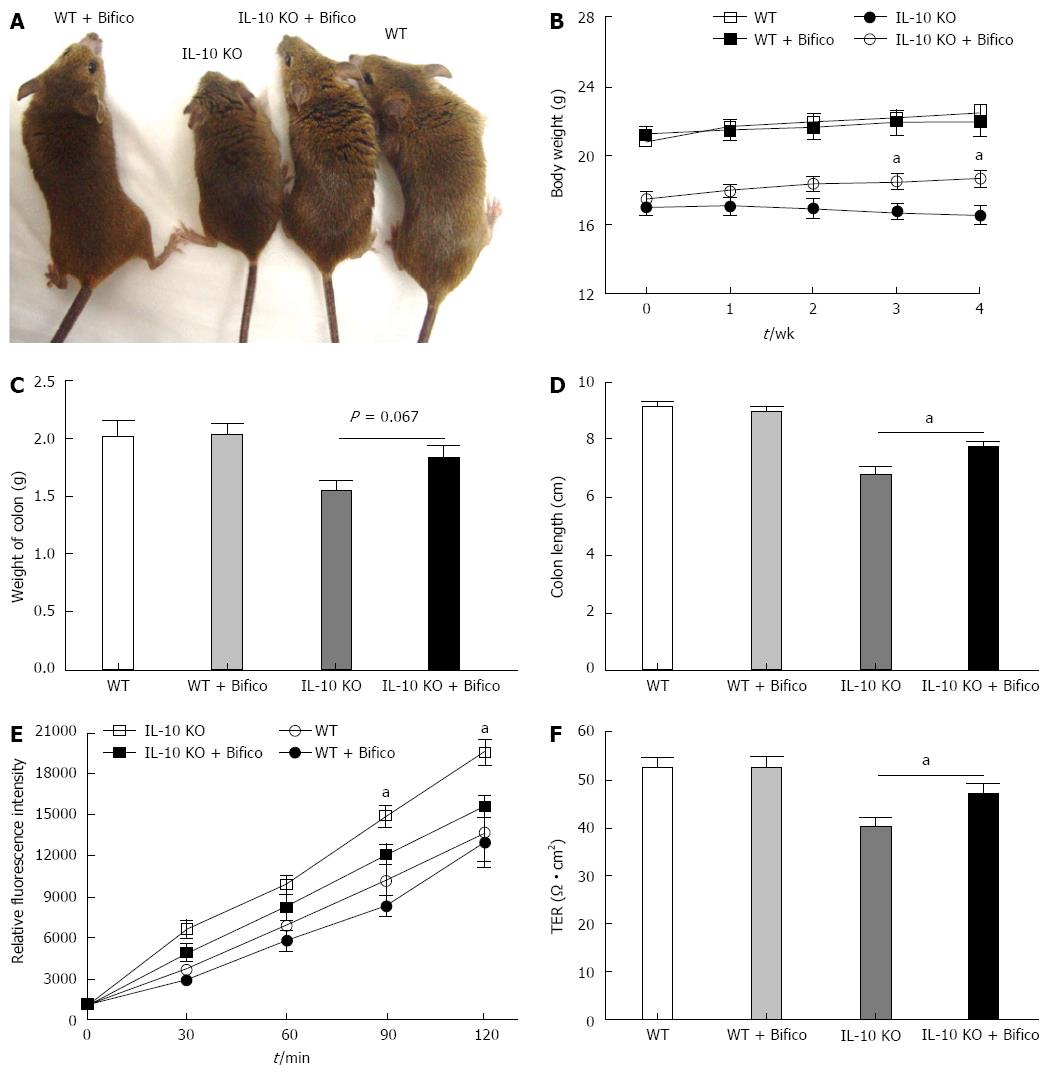
Figure 1 Bifico reduced clinical disease activity and prevented colonic epithelial permeability in interleukin-10 gene-deficient mice.
A: Representative photographs from the indicated mice for 4 wk following Bifico treatment; B: Changes in body weight. The IL-10 KO group was significantly lighter than the IL-10 KO + Bifico group (mean ± SEM, n = 6 per time point per group, aP < 0.05, Student’s t test); C: Colon weight were measured at 28 d following Bifico treatment; D: Colon length was measured at 28 d following Bifico treatment. IL-10 KO mice had shorter colons than IL-10 KO mice treated with Bifico. No difference in colon weight was observed (mean ± SEM, n = 6 per group, aP < 0.05, Student’s t test); E: Colonic paracellular permeability measured by cumulative permeability of nonabsorbable tracer molecule inulin-FITC; F: Colonic paracellular permeability measured by TER. IL-10 KO mice presented higher permeability than IL-10 KO mice treated with Bifico (mean ± SEM, n = 5 per time point per group, aP < 0.05, Student’s t test).
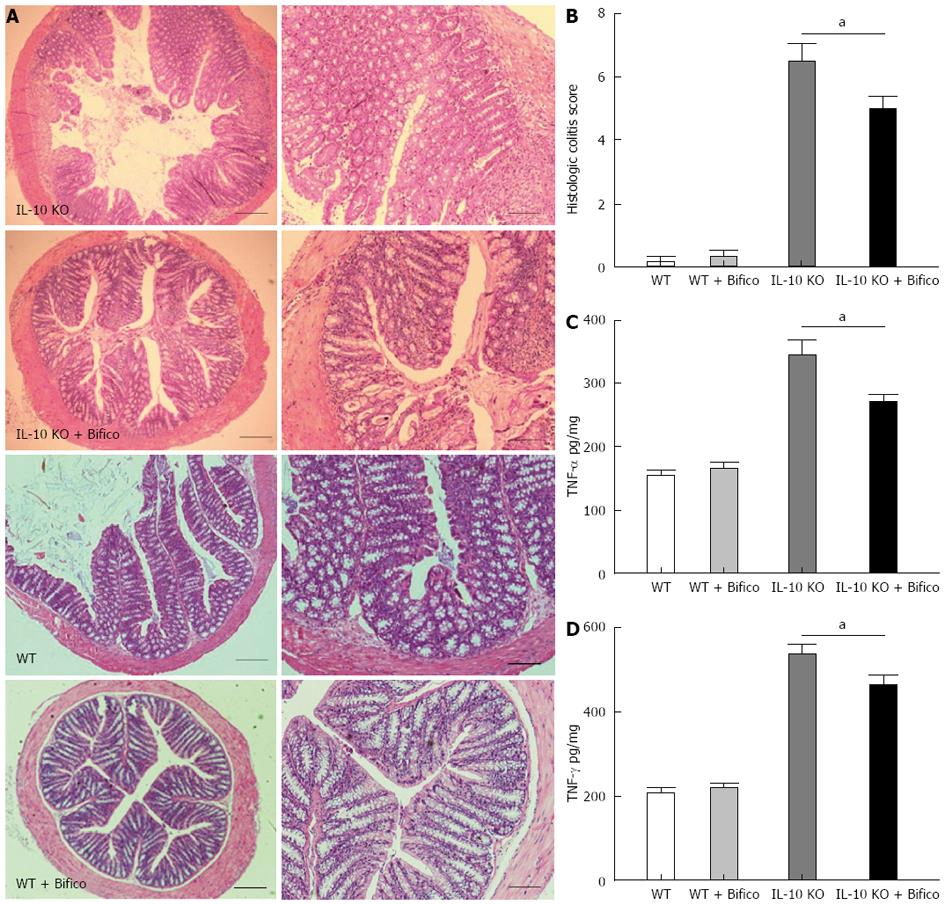
Figure 2 Bifico attenuated inflammation and production of proinflammatory cytokines.
A: Representative photomicrographs showing colonic inflammation and damage (HE stain, × 40 magnification, higher magnification photomicrographs on the right × 100); B: Histological colitis scores (mean ± SEM, n = 6 per group, aP < 0.05, Student’s t test); C and D: TNF-α and IFN-γ were measured by ELISA in colon after 4 wk Bifico treatment (mean ± SEM, n = 6 per group, aP < 0.05, Student’s t test).
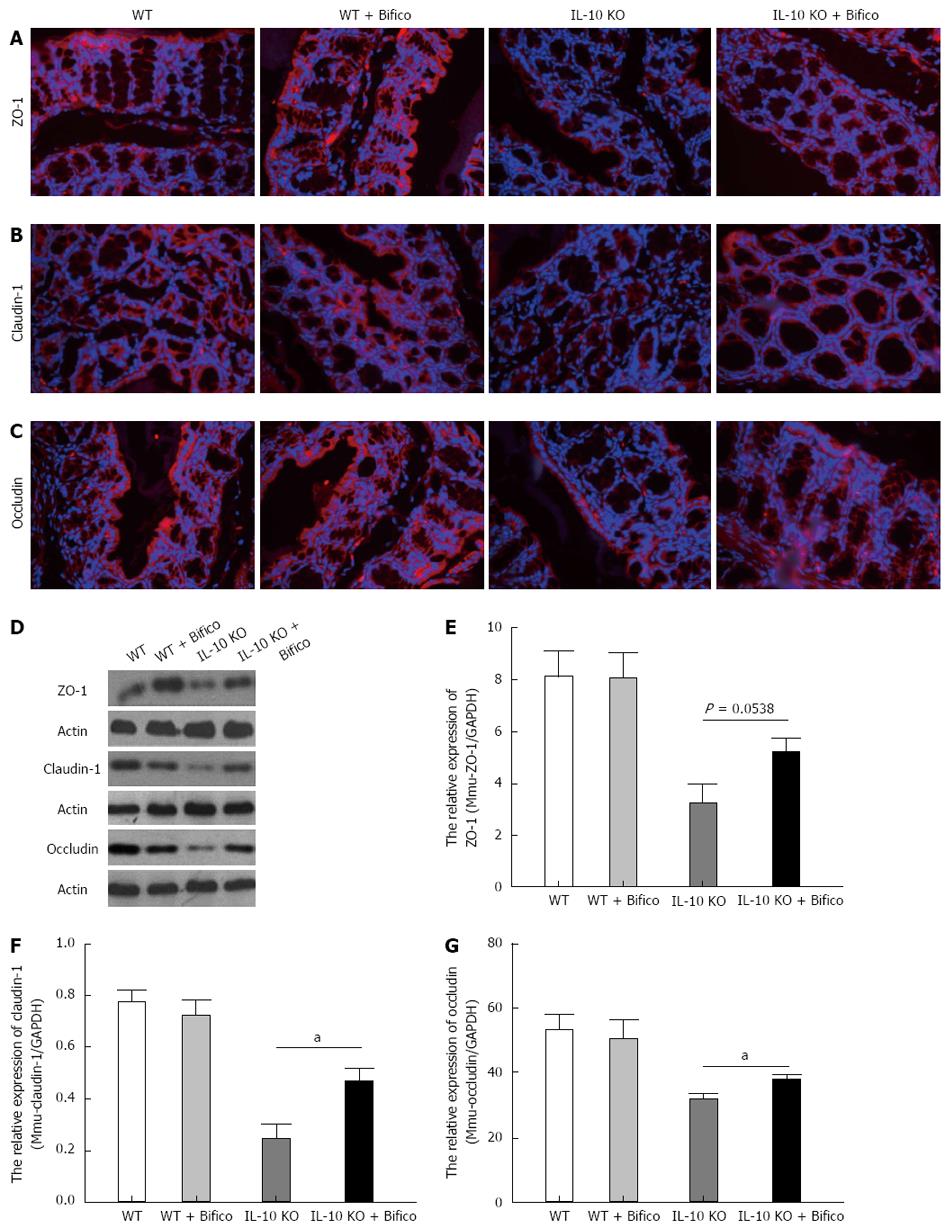
Figure 3 Bifico increased expression of tight junction proteins in interleukin-10 gene-deficient mice.
A: Representative immunofluorescence photomicrographs for tight junction proteins zonula occludentes (ZO)-1, in the colonic epithelium (n = 3 for each group); B: Representative immunofluorescence photomicrographs for tight junction proteins claudin-1 (n = 3 for each group); C: Representative immunofluorescence photomicrographs for tight junction proteins occludin (n = 3 for each group).The tight junction proteins were stained red (× 400 magnification); D: Western blotting of tight junction proteins in the colonic tissues; E: mRNA expression of ZO-1 in the colon (mean ± SEM, n = 4-6 per group, aP < 0.05, Student’s t test); F: mRNA expression of claudin-1 in the colon (mean ± SEM, n = 4-6 per group, aP < 0.05, Student’s t test); G: mRNA expression of occludin in the colon (mean ± SEM, n = 4-6 per group, aP < 0.05, Student’s t test).
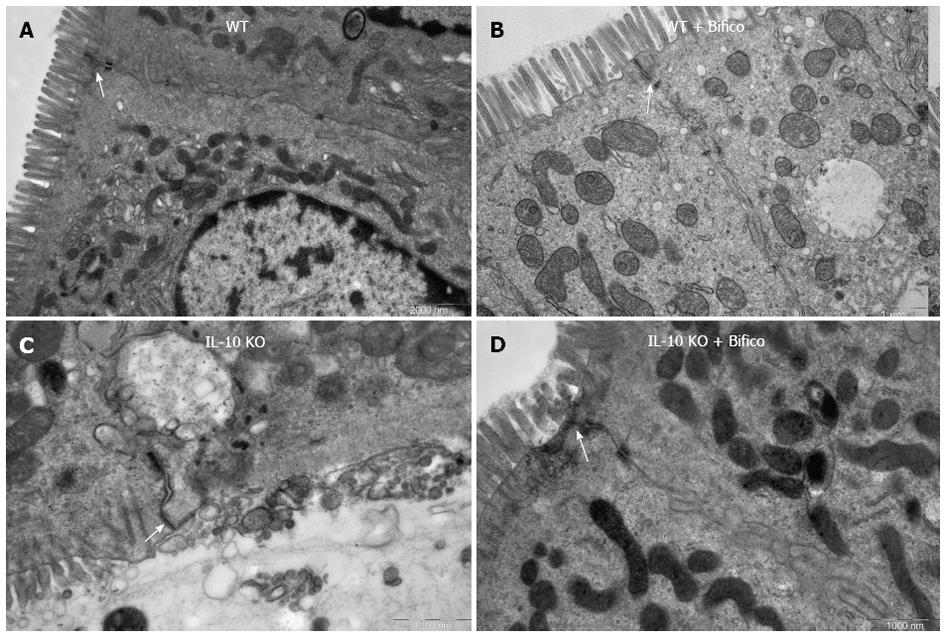
Figure 4 Bifico ameliorated the ultrastructure of colonic epithelium in interleukin-10 gene-deficient mice.
A: Intercellular tight junctions (indicated by the white arrows) and normal ultrastructure in colonic epithelium of WT (scale bar = 2000 nm); B: Intercellular tight junctions (indicated by the white arrows) and normal ultrastructure in colonic epithelium of Bifico treated WT mice (scale bar = 1000 nm); C: Tight junctions (indicated by the white arrows) and microvilli, increased intercellular gap, and abnormal ultrastructure of epithelial cells in the colonic epithelium of IL-10 KO mice (scale bar = 1000 nm); D: Partly recovered intercellular tight junctions (indicated by the white arrows) and microvilli in colonic epithelium of Bifico treated IL-10 KO mice (scale bar = 1000 nm).
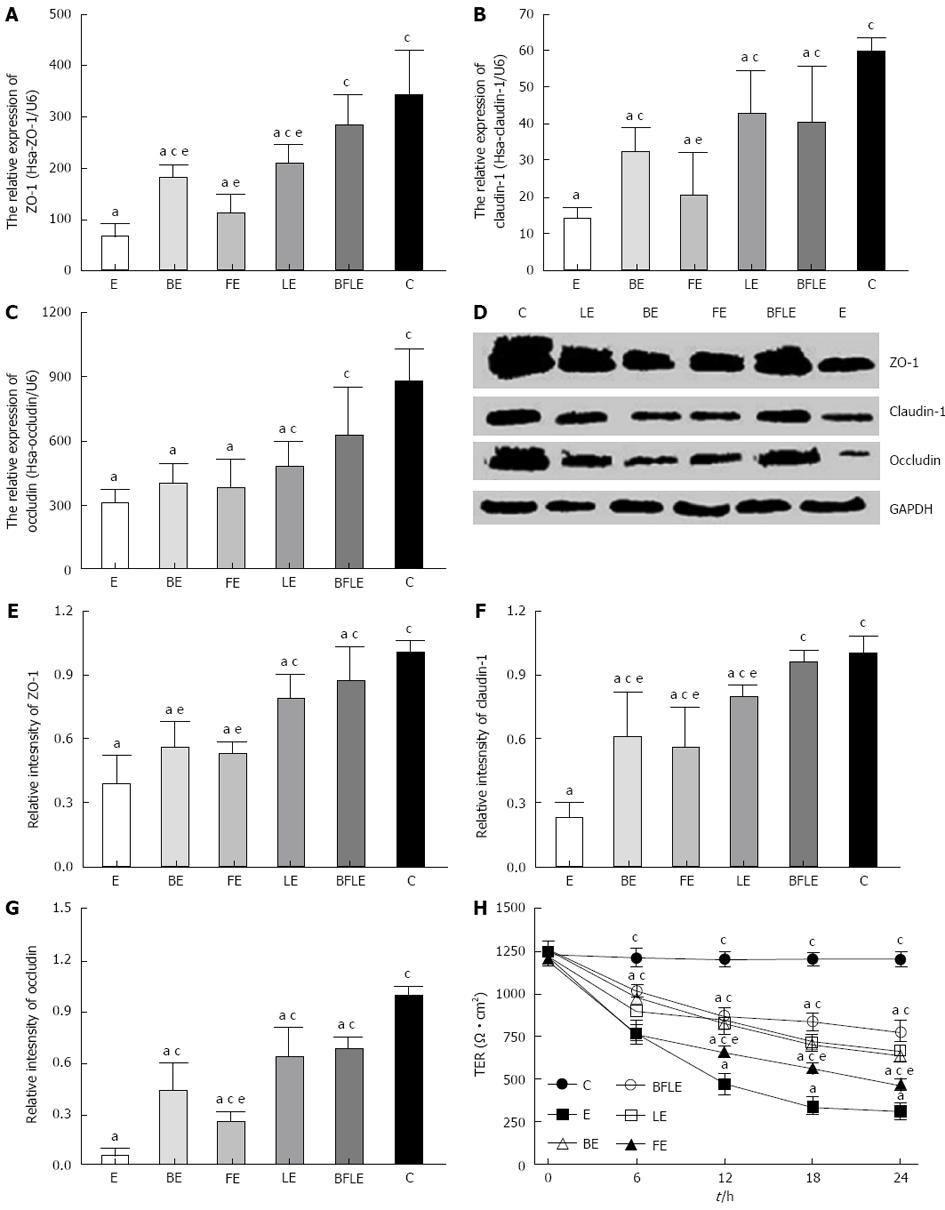
Figure 5 Bifico rescued expression of tight junction-associated proteins in following Enteroinvasive Escherichia coli infection.
A: mRNA levels of tight junction proteins zonula occludentes (ZO)-1 were significantly decreased in Caco-2 monolayers after treatment with Enteroinvasive Escherichia coli (EIEC) in comparison to control untreated cells; B: mRNA levels of tight junction proteins claudin-1 were significantly decreased in Caco-2 monolayers; C: mRNA levels of tight junction proteins occludin were significantly decreased in Caco-2 monolayers. This decrease was reversed by pretreatment with Bifico or single strain probiotics; D: Representative experiment showing western blot (WB) analysis of ZO-1, claudin-1 and occludin expression; E: Expression of ZO-1 was quantified by densitometry for three independent experiments; F: Expression of cllaudin-1 was quantified by densitometry for three independent experiments; G: Expression of occludin was quantified by densitometry for three independent experiments; H: Bifico or single-strain probiotics increased the EIEC-treated TER of Caco-2 monolayers (means ± SEM, n = 3 per group in WB, n = 5 per group in qRT-PCR, n = 5 per time point per group in TER. aP < 0.05 compared with control group, cP < 0.05 compared with EIEC group, eP < 0.05 compared with BFLE group, Student’s t test). B. longum (B), E. faecalis (F), L. acidophilus (L), triple bacteria (BFL), control group (C), EIEC group (E). Preincubated with probiotics or/and commensal bacteria prior to EIEC infection created four groups (BE, FE, LE and BFLE).
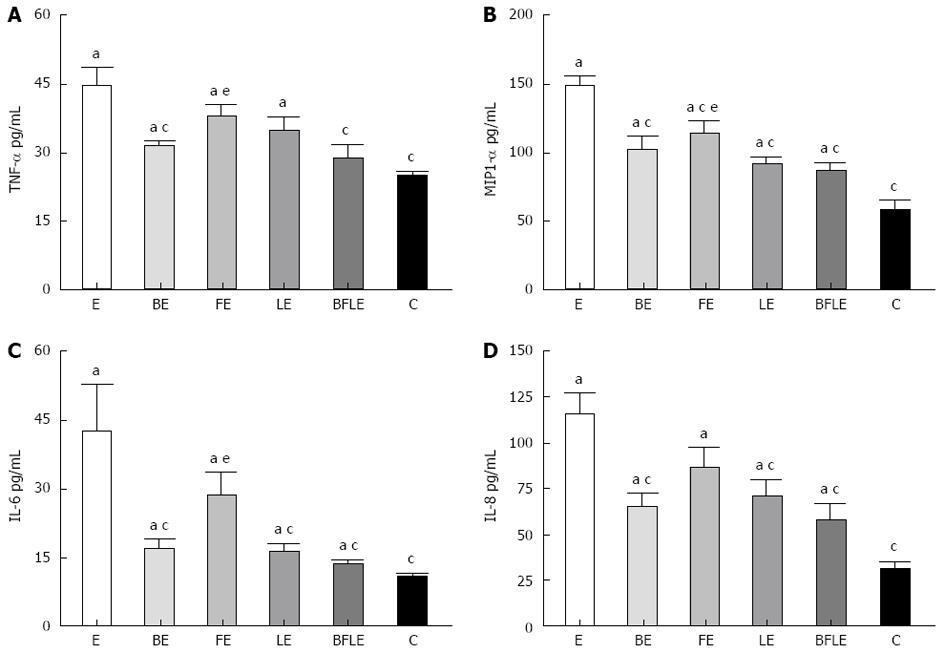
Figure 6 Bifico inhibited Enteroinvasive Escherichia coli-induced proinflammatory cytokines secretion.
A: The level of TNF-α was significantly inhibited by Bifico or single-strain probiotic pre-treatment of Caco-2 monolayers prior to Enteroinvasive Escherichia coli (EIEC) infection; B: The level of macrophage inflammatory protein (MIP)-1α was significantly inhibited by Bifico or single-strain probiotic pre-treatment of Caco-2 monolayers prior to EIEC infection; C: The level of IL-6 was significantly inhibited by Bifico or single-strain probiotic pre-treatment of Caco-2 monolayers prior to EIEC infection; D: The level of IL-8 was significantly inhibited by Bifico or single-strain probiotic pre-treatment of Caco-2 monolayers prior to EIEC infection (means ± SEM, n = 6 per group, aP < 0.05 compared with control group, cP < 0.05 compared with EIEC group, eP < 0.05 compared with BFLE group, Student’s t test).
- Citation: Shi CZ, Chen HQ, Liang Y, Xia Y, Yang YZ, Yang J, Zhang JD, Wang SH, Liu J, Qin HL. Combined probiotic bacteria promotes intestinal epithelial barrier function in interleukin-10-gene-deficient mice. World J Gastroenterol 2014; 20(16): 4636-4647
- URL: https://www.wjgnet.com/1007-9327/full/v20/i16/4636.htm
- DOI: https://dx.doi.org/10.3748/wjg.v20.i16.4636


