Copyright
©2014 Baishideng Publishing Group Co.
World J Gastroenterol. Apr 28, 2014; 20(16): 4546-4557
Published online Apr 28, 2014. doi: 10.3748/wjg.v20.i16.4546
Published online Apr 28, 2014. doi: 10.3748/wjg.v20.i16.4546
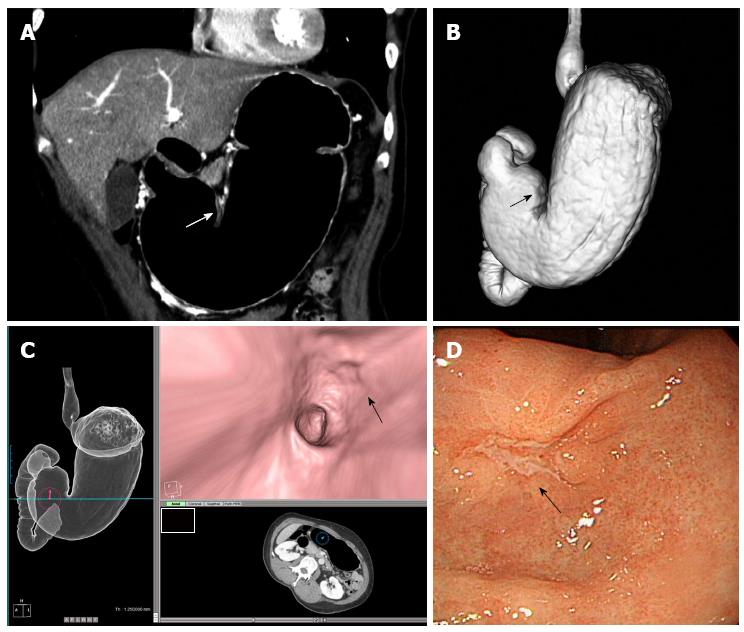
Figure 1 T1a gastric cancer in a 53-year-old female patient.
A: Coronal 2D image shows small mucosal enhancement (arrow) in the lesser curvature side of the antrum; B: Computed tomography gastrography shows a small mucosal irregularity (arrow) in the same area; C: Virtual gastroscopy delineates a shallow, depressed lesion (arrow); D: Endoscopy reveals a small mucosal irregularity confined to the mucosa (arrow). Endoscopic submucosal dissection was performed and pathological examination revealed pT1a early gastric cancer.
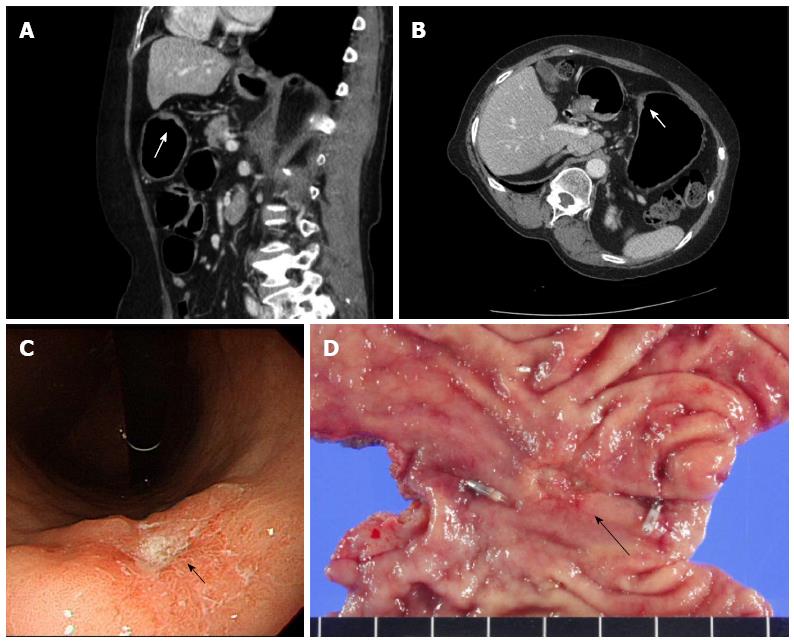
Figure 2 T2 gastric cancer in a 66-year-old female patient.
A: Sagittal 2D image shows enhancing wall thickening with ulceration (arrow) in the lesser curvature side of the low body of the stomach; B: Left posterior oblique axial 2D image also delineates enhancing wall thickening (arrow) in the lesser curvature side of the low body of the stomach. The enhancing lesion involves the entire gastric wall layer, and no low attenuated stripe is visible at the base of the tumor; C: Endoscopy reveals a protruding mass with ulceration (arrow). The impression of the endoscopist was early gastric cancer; D: Subtotal gastrectomy was performed and pathological examination revealed pT2 gastric cancer (arrow).
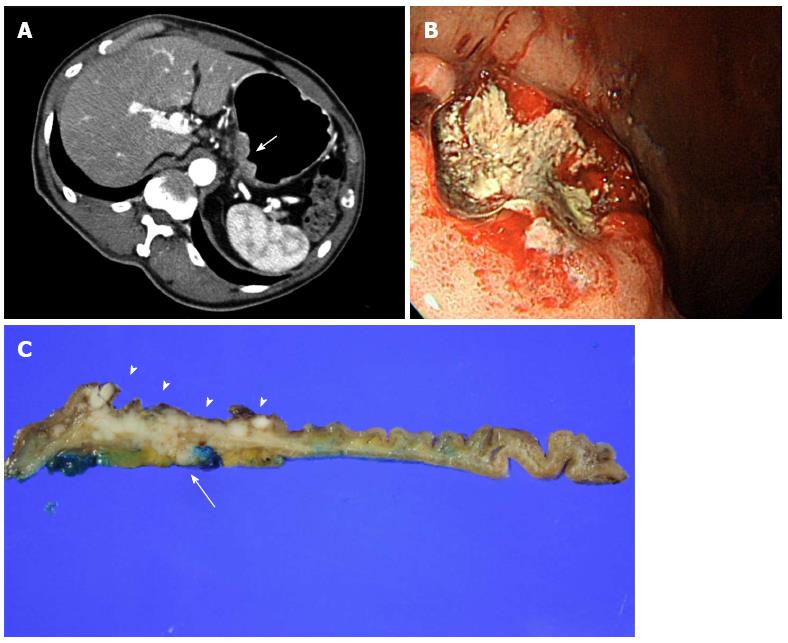
Figure 3 T3 gastric cancer in a 63-year-old male patient.
A: Right decubitus 2D axial image shows thickening of the gastric wall (arrow) involving the entire layer. Perigastric infiltrations are noted outside of the tumor; B: Endoscopy reveals a large ulcerative tumor; C: Surgical specimen showing the tumor (arrowheads) and tumor extension to perigastric fat (arrow).
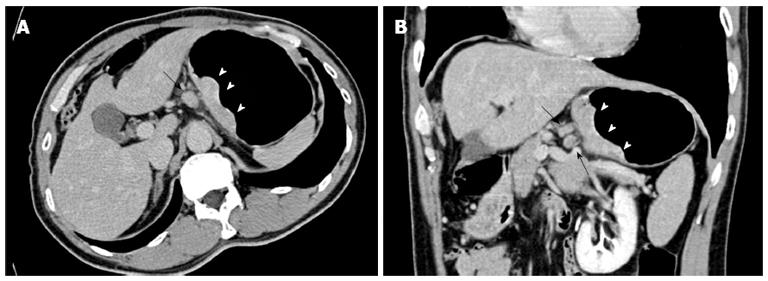
Figure 4 T4a gastric cancer in a 72-year-old male patient.
A: Left posterior oblique axial 2D image shows prominent wall thickening of the gastric body (arrow) abutting the pancreas (arrowheads); B: Sagittal 2D image delineates reserved fat plane (black arrow) between the gastric mass (white arrow) and pancreas (curved arrow); C: Right decubitus 2D image delineates a change in positions between the mass (arrow) and pancreas (arrowheads). This finding is called a “sliding sign” and is considered evidence of non-invasion of an adjacent organ on imaging.
Figure 5 A prominent lymph node in a 57-year-old male patient with advanced gastric cancer.
A: Left posterior oblique axial 2D image shows a large gastric mass (arrowheads) in the posterior wall of the gastric body and an enlarged lymph node (arrow). The LN diameter was 12 mm; B: Coronal 2D image shows a gastric mass (arrowheads) and two enlarged lymph nodes (arrows).
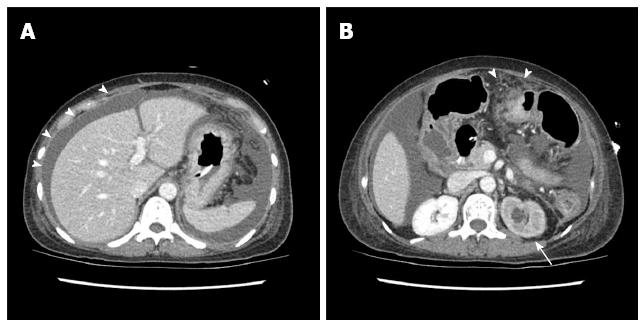
Figure 6 Peritoneal carcinomatosis in a 48-year-old female patient with advanced gastric cancer.
A: Axial 2D CT image shows a large volume of ascites and peritoneal thickening (arrowheads); B: Axial 2D CT image at a lower level than (A) delineates ascites, omental infiltration and nodules (arrowheads), and hydronephrosis of the left kidney (arrow).
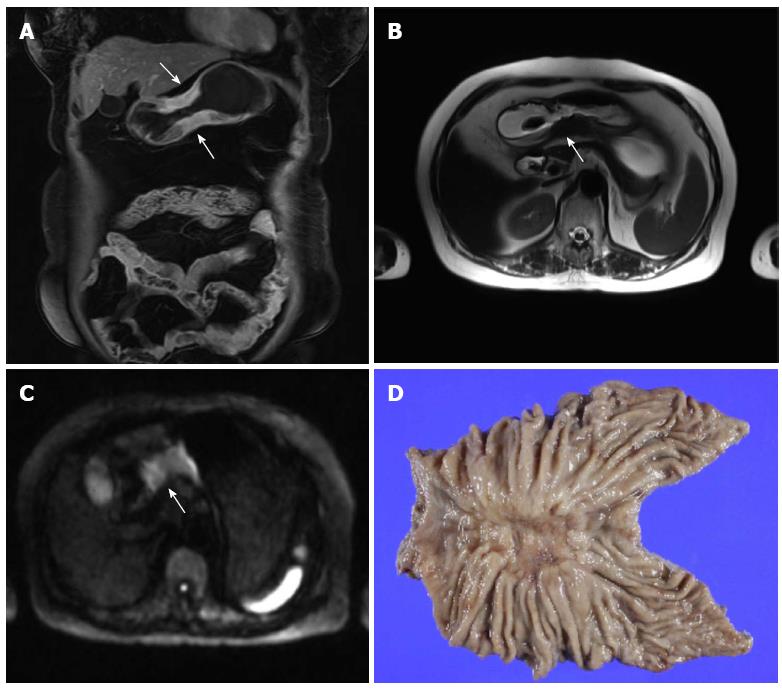
Figure 7 Magnetic resonance imaging of gastric cancer in a 71-year-old female patient.
A: Coronal image of contrast enhanced magnetic resonance imaging (MRI) shows enhancing wall thickening of the gastric body (arrows); B: T2-weighted image delineates a low echoic mass (arrow) destroying layers of the gastric wall. The outer border of the mass is irregular; C: Diffusion-weighted image with a b-value of 1000 shows a high signal intensity mass (arrow) with diffusion restriction; D: Subtotal gastrectomy was performed, and pathological examination revealed pT3 cancer.
- Citation: Choi JI, Joo I, Lee JM. State-of-the-art preoperative staging of gastric cancer by MDCT and magnetic resonance imaging. World J Gastroenterol 2014; 20(16): 4546-4557
- URL: https://www.wjgnet.com/1007-9327/full/v20/i16/4546.htm
- DOI: https://dx.doi.org/10.3748/wjg.v20.i16.4546


