Copyright
©2014 Baishideng Publishing Group Co.
World J Gastroenterol. Mar 21, 2014; 20(11): 2913-2926
Published online Mar 21, 2014. doi: 10.3748/wjg.v20.i11.2913
Published online Mar 21, 2014. doi: 10.3748/wjg.v20.i11.2913
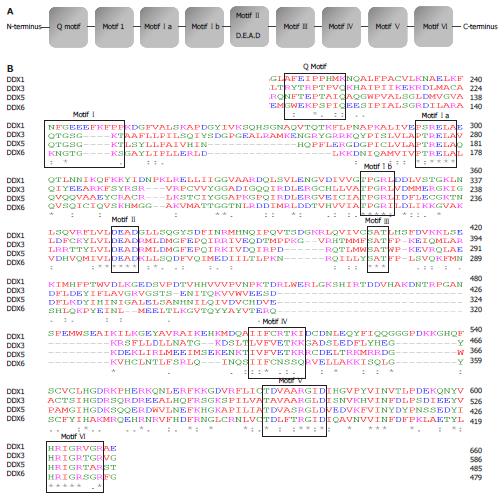
Figure 1 Schematic diagram of DEAD-box proteins and sequence alignment of selected members.
A: Conserved motifs within the DEAD-box family; B: Sequences of the conserved motifs-Q motif, I, Ia, Ib, II, III, IV, V, VI from DDX1, DDX3, DDX5 and DDX6.
Figure 2 Analysis of protein expression following knockdown of endogenous DDX5, DDX3 and DDX6 in Huh7.
5 cells. A: Cells transfected with 40 nmol/L of DDX5 short interfering RNA (siRNA) or a control siRNA; B: Cells transfected with 40 nmol/L of DDX3 siRNA or control siRNA; C: Cells transfected with 40 nmol/L of DDX6 siRNA or control siRNA. At 48 h, cells were infected with J6/JFH-1 (p47) hepatitis C virus (HCV) at multiplicity of infection of 2 as previously described[72]. Cell lysates were prepared 0, 2, 4 d post-infection (d.p.i.) and subjected to immunoblotting with the respective primary antibodies. Expression of NS5B was used to confirm HCV infection and β-actin served as a loading control. Three independent experiments were performed and one representative set of data is shown.
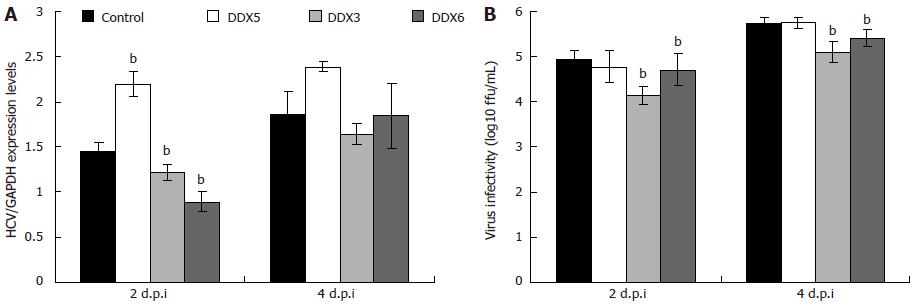
Figure 3 Analysis of viral replication and viral infectivity following knockdown of endogenous DDX5, DDX3 and DDX6 in Huh7.
5 cells. Cells transfected with DDX5 short interfering RNA (siRNA) in parallel with a control siRNA, DDX3 siRNA and DDX6 siRNA. At 48 h, cells were infected with J6/JFH-1(p47) hepatitis C virus (HCV) at an multiplicity of infection of 2. A: At 2 and 4 d.p.i., the total RNA was isolated from the cells, reverse transcribed, and the resulting cDNA was subjected to quantitative polymerase chain reaction for detection of genomic HCV RNA and glyceraldehyde-3-phosphate dehydrogenase mRNA as previously described[73]; B: Virus supernatants collected 2 and 4 d.p.i. were titrated on naive Huh7.5 cells by using indirect immunofluorescence as previously described[74] and expressed as focus forming units per millilitre (mL). Statistical analysis was performed using the two-tailed Student’s t test to determine if the differences between the gene specific siRNA-treated and control siRNA-treated cells were statistically significant. bP < 0.01 vs control siRNA-treated cells. Data were obtained from three independent experiments and one representative set of data is shown. Each measurement was performed in triplicate, and the average (± SD) is presented.
- Citation: Upadya MH, Aweya JJ, Tan YJ. Understanding the interaction of hepatitis C virus with host DEAD-box RNA helicases. World J Gastroenterol 2014; 20(11): 2913-2926
- URL: https://www.wjgnet.com/1007-9327/full/v20/i11/2913.htm
- DOI: https://dx.doi.org/10.3748/wjg.v20.i11.2913


