Copyright
©The Author(s) 1996.
World J Gastroenterol. Sep 15, 1996; 2(Suppl1): 118-119
Published online Sep 15, 1996. doi: 10.3748/wjg.v2.iSuppl1.118
Published online Sep 15, 1996. doi: 10.3748/wjg.v2.iSuppl1.118
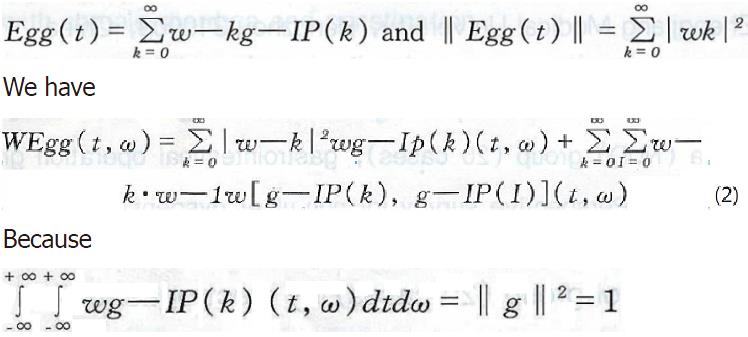
Math 1 Math(A1).
Math 2 Math(A2).
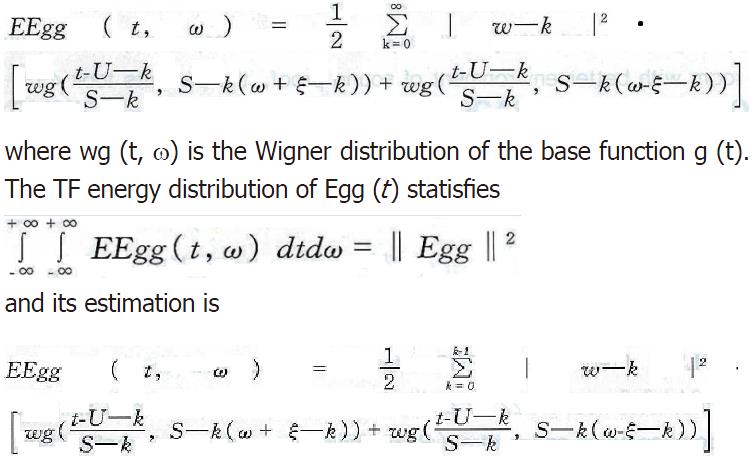
Math 3 Math(A3).
Math 4 Math(A4).
Figure 1 The two of the gray images of the time frequency energy distribution of the four sets of data.
- Citation: Wang ZS, Li WH, He ZY, Chen JZ, Liang J. Neural network based adaptive time frequency analysis of EGG signals. World J Gastroenterol 1996; 2(Suppl1): 118-119
- URL: https://www.wjgnet.com/1007-9327/full/v2/iSuppl1/118.htm
- DOI: https://dx.doi.org/10.3748/wjg.v2.iSuppl1.118


