Copyright
©2013 Baishideng Publishing Group Co.
World J Gastroenterol. Feb 21, 2013; 19(7): 1056-1067
Published online Feb 21, 2013. doi: 10.3748/wjg.v19.i7.1056
Published online Feb 21, 2013. doi: 10.3748/wjg.v19.i7.1056
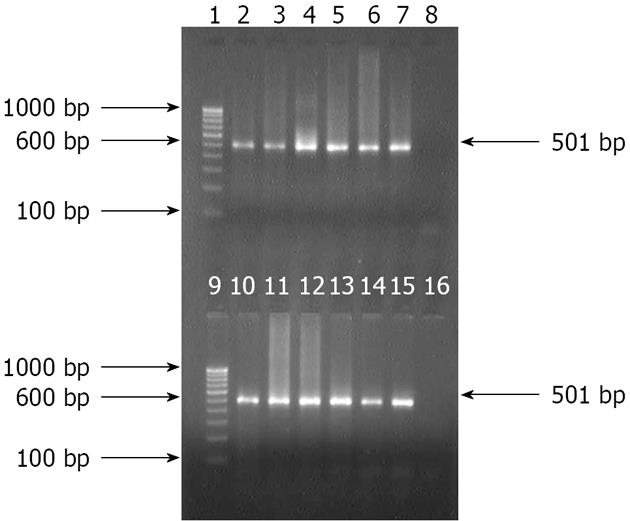
Figure 1 Amplification of partial 501 bp HSP60 gene with specific nested primer for Helicobacter pylori in antral biopsies and culture isolates.
Lanes 1 and 9: Molecular marker (100 bp); Lane 2: Positive control; Lanes 3 to 7: gDNA from antral biopsies; Lanes 8 and 16: Negative control; and Lanes 10 to 15: Bacterial gDNA from culture isolates.
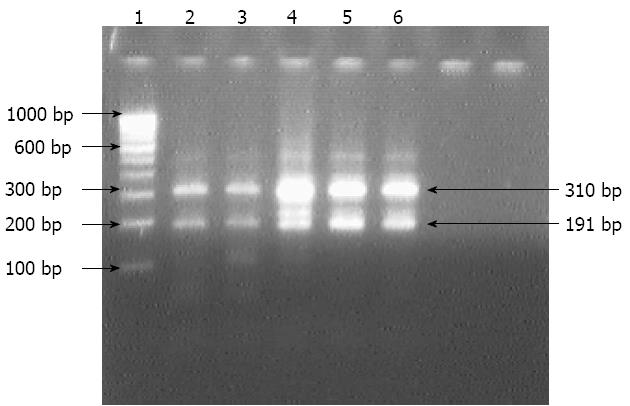
Figure 2 Electrophotograph of restriction digestion of HSP60 gene of Helicobacter pylori isolates with HindIII.
Lane 1: 100 bp molecular marker; Lanes 2 to 6: Restricted 501 bp HSP60 gene amplicon into two fragments (310 and 191 bp) of culture isolates of Helicobacter pylori.
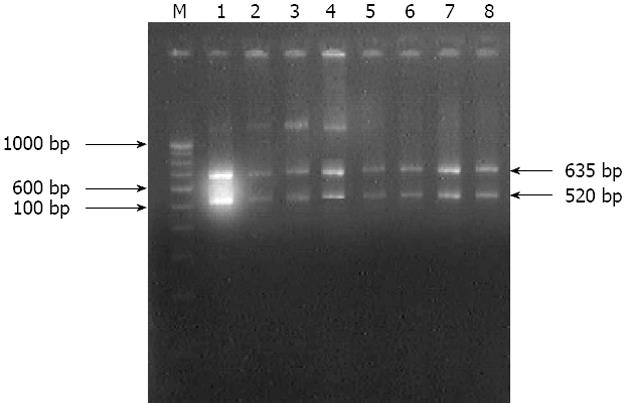
Figure 3 Gel picture of amplified rDNA restriction analysis.
Lane M: 100 bp molecular marker; Lanes 1 to 8: Digested 1155 bp 16S rRNA amplicon into two fragments (635 bp and 520 bp) of culture isolates of Helicobacter pylori.
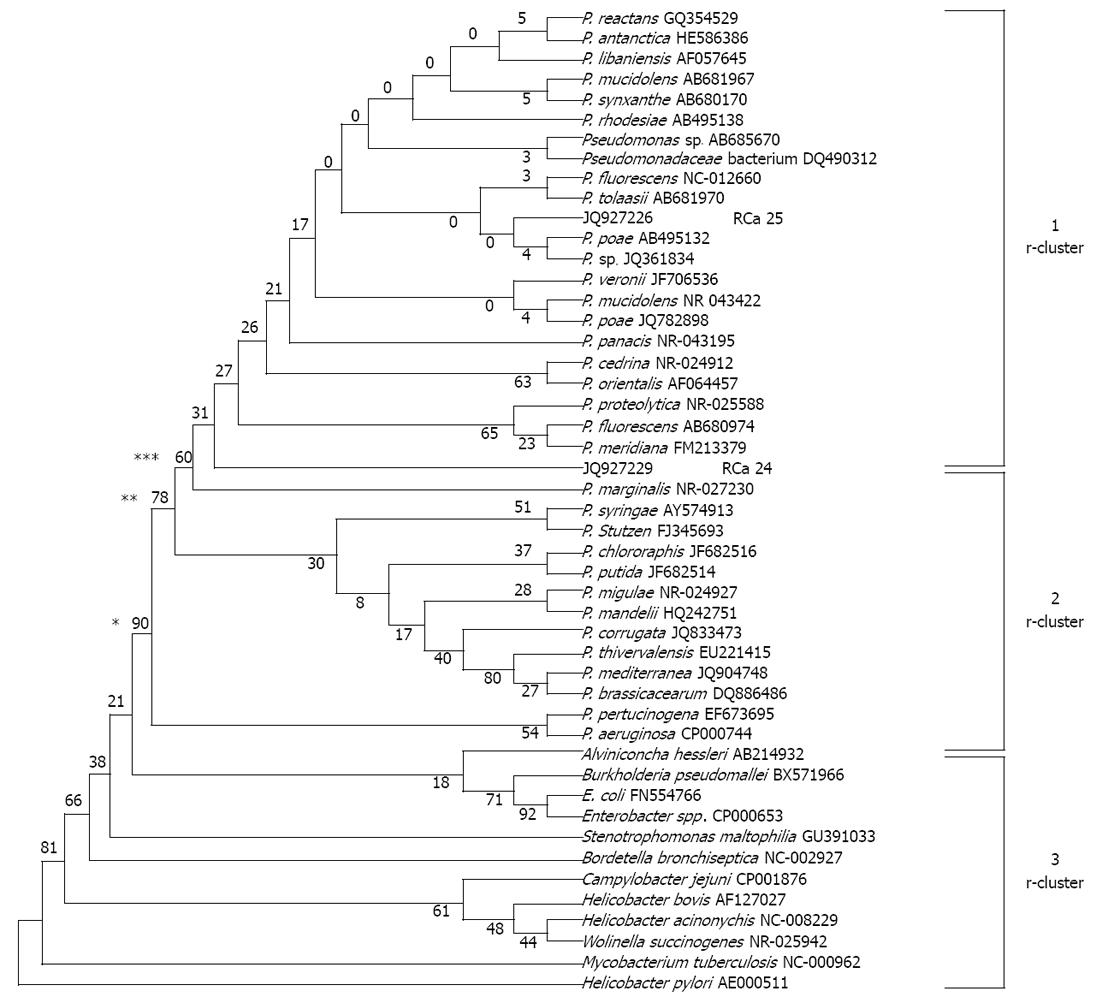
Figure 4 Phylogenetic affiliation of the Pseudomonas fluorescens-like isolates (n = 2; JQ927226 and JQ927227).
The unrooted tree was generated using unweighted pair group method with arithmetic mean from evolutionary distance computed with bootstrap test of phylogeny using MEGA version 4 by aligning published sequences from Genbank of 16S rRNA genes from 34 reference strains representative of the principal Pseudomonas (P.) phyla (accession number followed by species name in parentheses). For checking relatedness with other genera, we included 16S rRNA gene sequences from GenBank of 12 bacterial pathogens namely Stenotrophomonas maltophilia, Bordetella bronchiseptica, Wolinella succinogenes, Helicobacter pylori, Helicobacter acinonychis, Escherichia coli (E. coli), Enterobacter spp., Campylobacter jejuni, Burkholderia pseudomallei, Alviniconcha hessleri, Helicobacter bovis and Mycobacterium tuberculosis. Branches found by maximum likelihood are labeled with asterisks: one asterisk if bootstrap values = 90%, two asterisks if = 78% and three asterisks if = 60%.
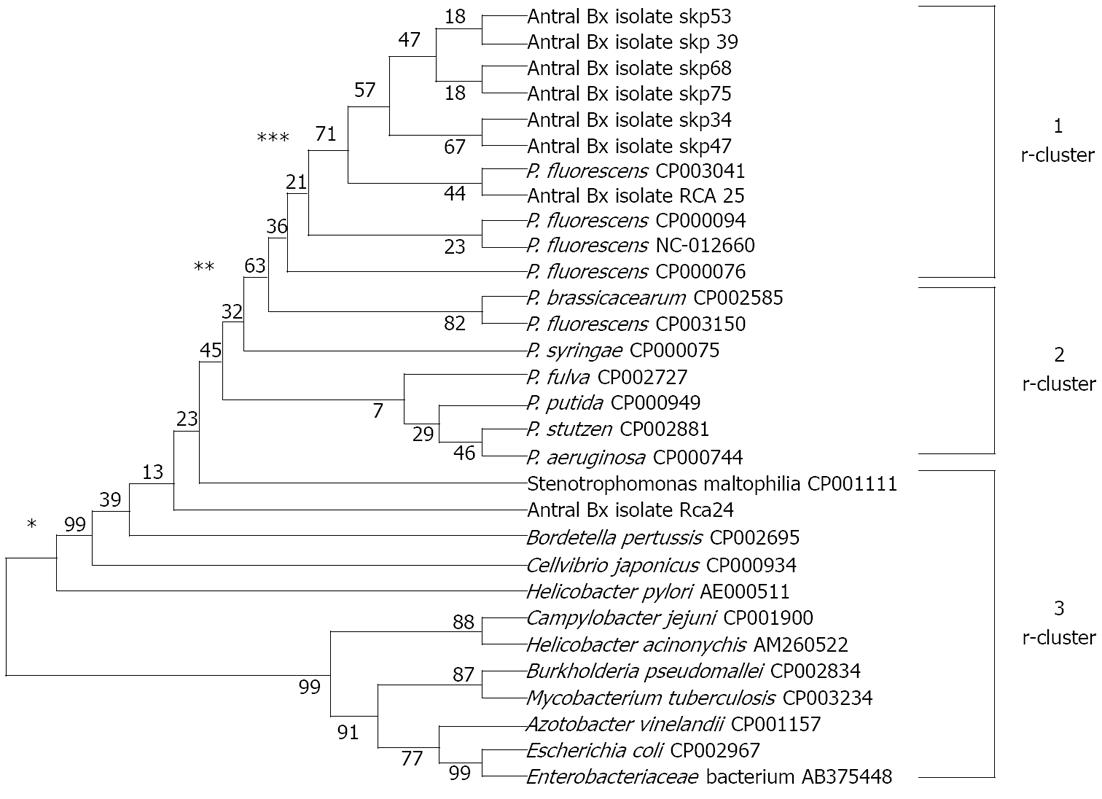
Figure 5 Phylogenetic affiliation of the Pseudomonas fluorescens-like isolates (n = 8; partial sequences of HSP60) on the basis of HSP60 gene sequences.
The unrooted tree was generated using unweighted pair group method with arithmetic mean from evolutionary distance computed with bootstrap test of phylogeny using MEGA version 4 by aligning published sequences from Genbank of heat shock protein (HSP60) genes from 5 reference strains of Pseudomonas fluorescens (P. fluorescens), 6 other reference strains representative of the principal Pseudomonas phyla (accession number followed by species name in parentheses). For checking relatedness with other genera, we included HSP60 gene sequences from GenBank of 11 bacterial pathogens, namely Helicobacter pylori, Helicobacter acinonychis, Campylobacter jejuni, Enterobacter spp., Escherichia coli, Bordetella pertussis, Burkholderia pseudomallei, Stenotrophomonas maltophilia, Cellvibrio japonicus, Azotobacter vinelandii and Mycobacterium tuberculosis. Branches found by maximum likelihood are labeled with asterisks: one asterisk if bootstrap values = 99%, two asterisks if = 63% and three asterisks if = 71%.
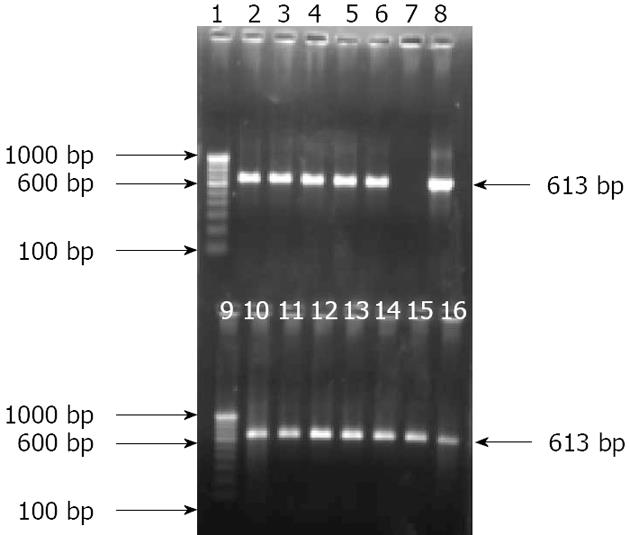
Figure 6 Amplification of putative outer membrane protein gene with specific nested primer generating 613 bp amplicon for Pseudomonas fluorescens of antral biopsies and culture isolates.
Lanes 1 and 9: Molecular marker (100 bp); Lanes 2 to 6: gDNA from antral biopsy specimens; Lane 7: Negative control; Lane 8: Positive control; and Lanes 10 to 16: Bacterial gDNA from culture isolates.
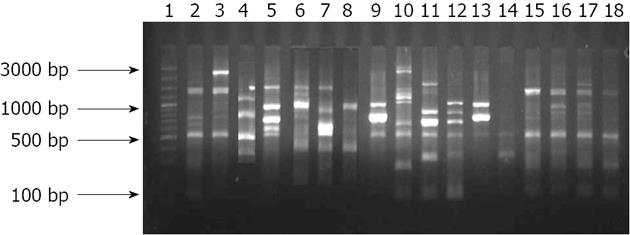
Figure 7 Representative gel showing amplification of Pseudomonas fluorescens genomic sequences by randomly amplified polymorphic DNA primers.
Randomly amplified polymorphic DNA (RAPD) 3 5’-TACAGCTCG-3’ and RAPD5 5’-AGCACTGCCT-3’. Lane 1: 100 bp molecular marker; Lanes 2 to 18: Pseudomonas fluorescens isolates isolated from stomach.
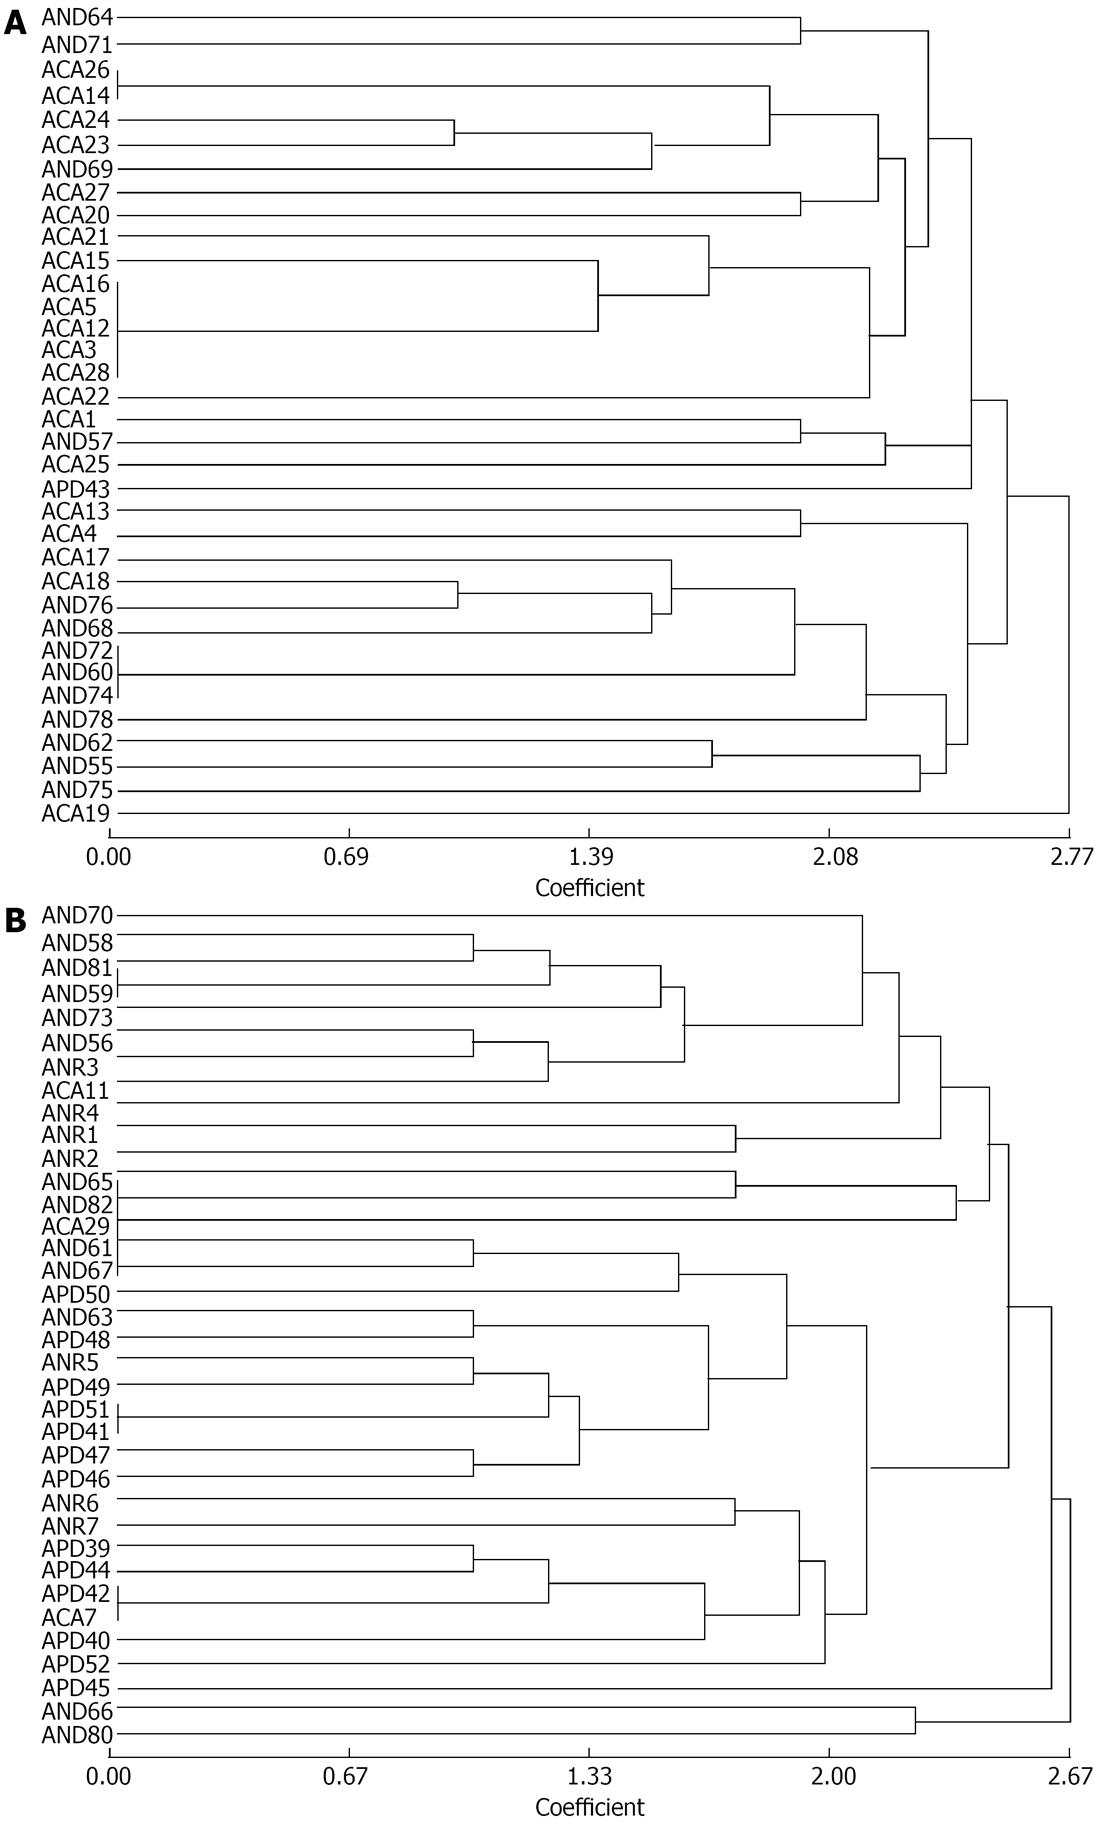
Figure 8 Dendrogram generated by unweighted pair-group method, arithmetic mean on basis of banding pattern of randomly amplified polymorphic DNA for Pseudomonas fluorescens.
A: 1-35 out of 71 randomly selected isolates of Pseudomonas fluorescens from group A (n = 35); B: 36-71 out of 71 randomly selected isolates of Pseudomonas fluorescens from group A (n = 36).
-
Citation: Patel SK, Pratap CB, Verma AK, Jain AK, Dixit VK, Nath G.
Pseudomonas fluorescens -like bacteria from the stomach: A microbiological and molecular study. World J Gastroenterol 2013; 19(7): 1056-1067 - URL: https://www.wjgnet.com/1007-9327/full/v19/i7/1056.htm
- DOI: https://dx.doi.org/10.3748/wjg.v19.i7.1056


