Copyright
©2013 Baishideng Publishing Group Co.
World J Gastroenterol. Nov 7, 2013; 19(41): 7078-7088
Published online Nov 7, 2013. doi: 10.3748/wjg.v19.i41.7078
Published online Nov 7, 2013. doi: 10.3748/wjg.v19.i41.7078
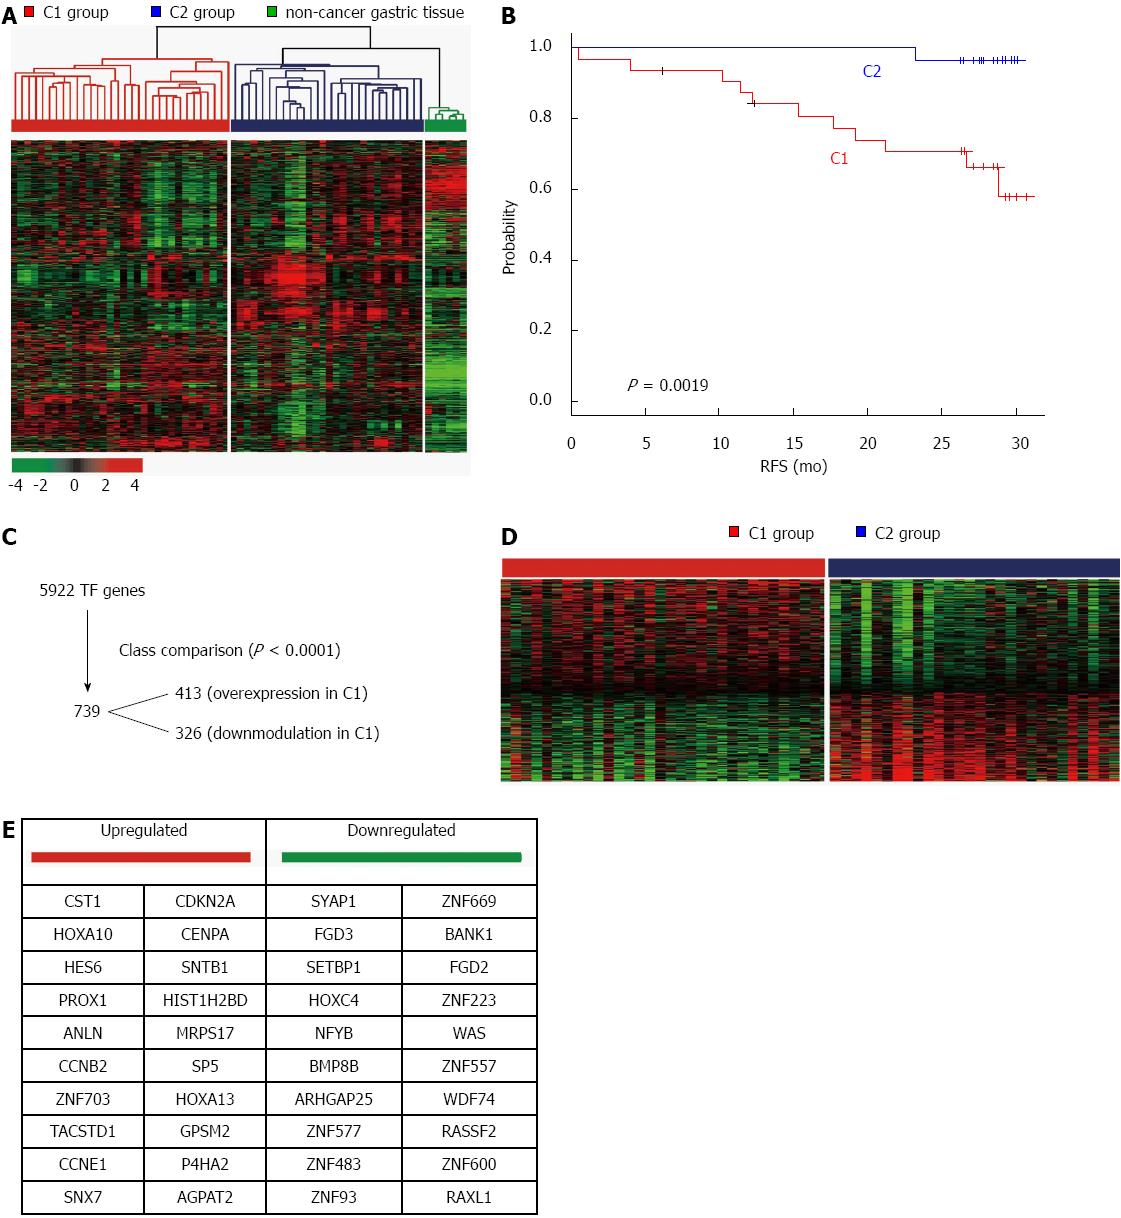
Figure 1 Two prognostic groups of patients with gastric cancer, C1 and C2, have distinct mRNA expression patterns.
A: mRNA expression patterns of gastric cancer and non-cancer gastric tissue are depicted in a heat map. Hierarchical clustering revealed two subtypes of gastric cancer, C1 and C2. The data are presented as a matrix in which rows represent individual mRNAs and columns represent each tissue. The color red represents relatively high expression levels and green reflects lower expression levels; B: Kaplan-Meier plot of relapse-free survival (RFS) revealed C1 and C2 represented poor- and good-prognosis gastric cancer tissues, respectively; C: Workflow of C1-specific 739 transcription factors (TFs) selected from a total 5,922 TFs; D: Hierarchical clustering of gene expression for 739 TF genes; E: List of top 20 up- and down-regulated TF genes in the C1 group.
Figure 2 Aberrant microRNA expression in gastric cancer.
A: Flowchart of the data analysis to identify poor-prognosis C1-specific microRNAs. Four microRNAs (miR-196b, miR-135b, miR-93, and miR-29c*) were selected; B: Expression patterns of the four microRNAs are shown in a heat map for C1, C2, and non-cancer gastric tissues. The color yellow represents relatively high expression levels and blue reflects relatively low levels.
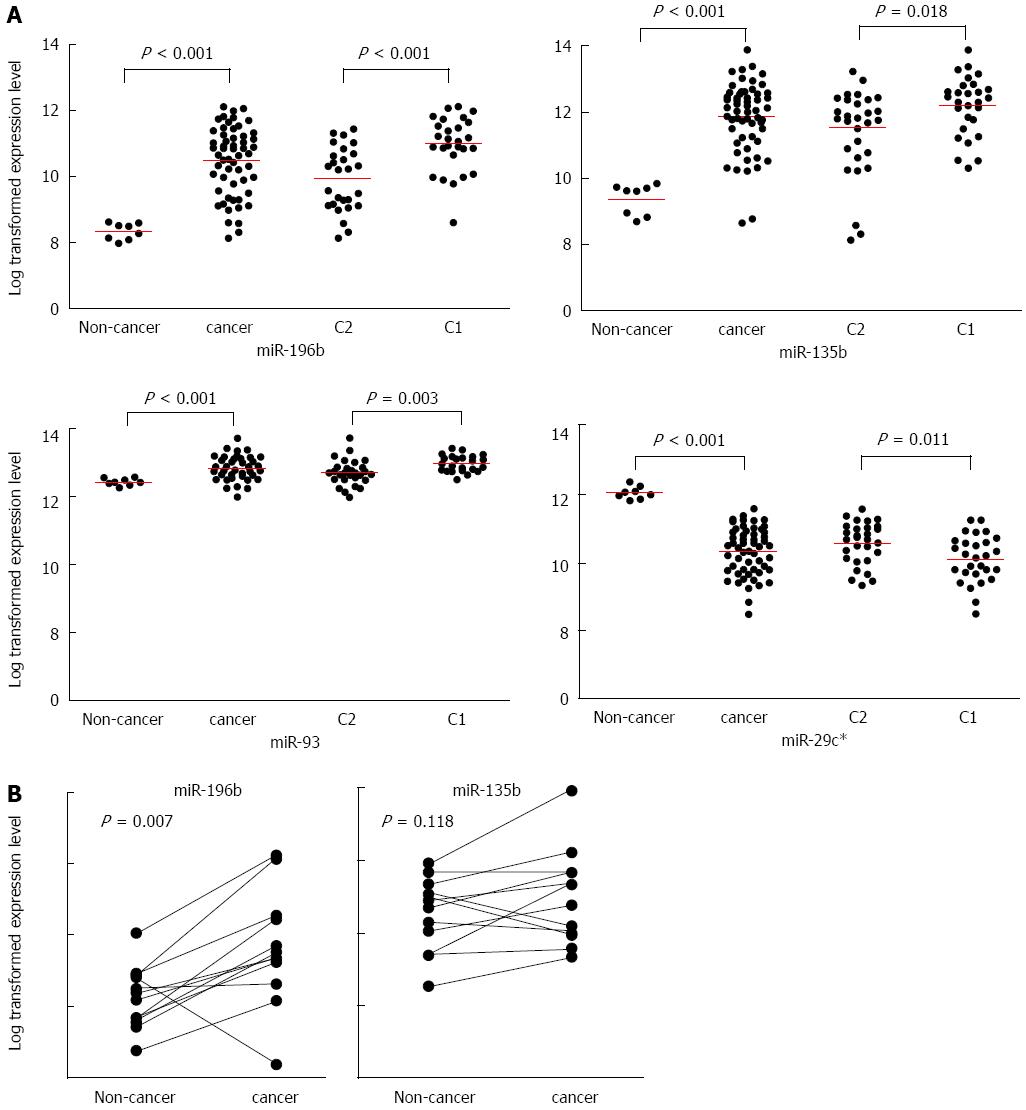
Figure 3 The expression levels of four microRNAs.
A: Four microRNAs expressed differentially in gastric tissues. Scatter plots of gene expression levels with a bar indicating the mean; B: The expression level of miR-196b and miR-135b were validated in a quantitative reverse transcription polymerase chain reaction study of 12 patients samples.
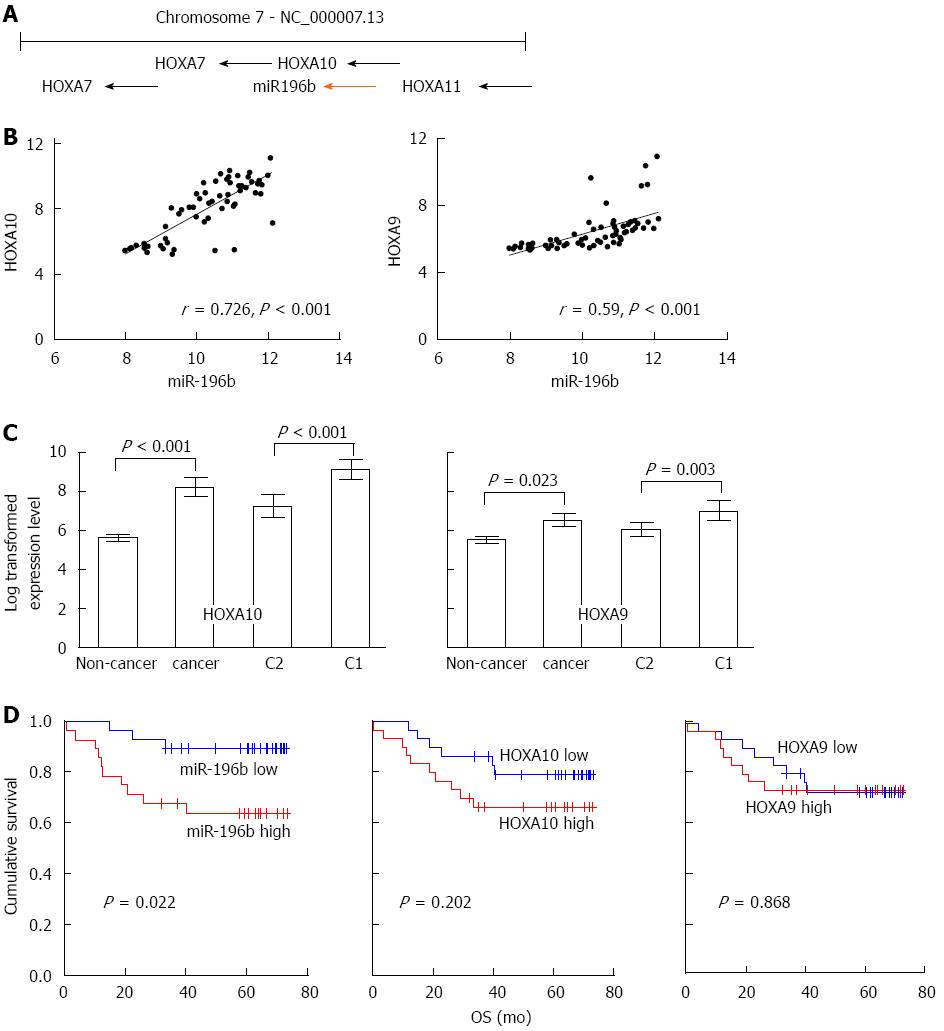
Figure 4 The correlation between miR-196b and homeobox A10 expression in gastric cancer.
A: miR-196b, homeobox A10 (HOXA10), and HOXA9 are neighbor genes and located on chromosome 7p15.2; B: Expression of miR-196b and HOXA10 were positively correlated (r = 0.726; P < 0.001). The correlation between miR-196b and HOXA9 expression was less significant; C: HOXA10 and HOPXA9 expression level in gastric cancer vs non-cancer tissues and in the C1 vs the C2 group. Results are presented as means with 95%CI; D: Kaplan–Meier plot of overall survival according to the expression level of miR-196b, HOXA10, and HOXA9.
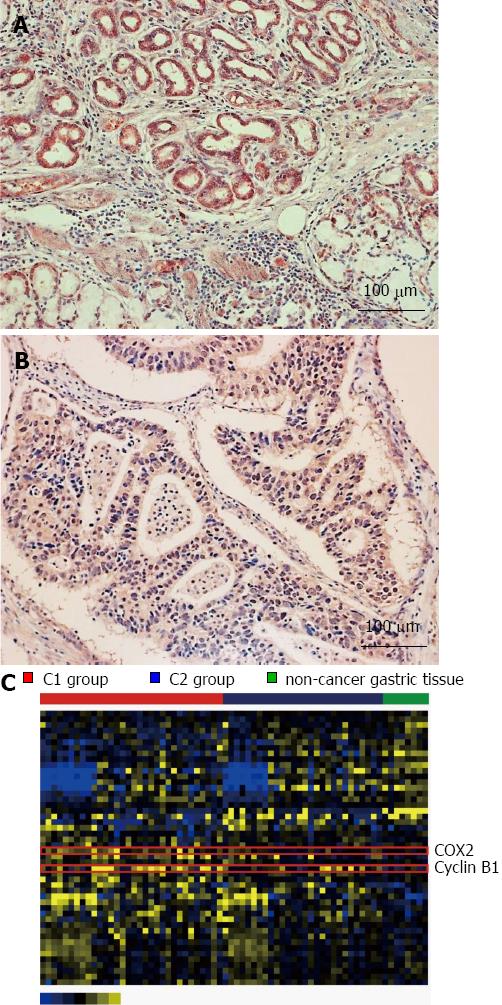
Figure 5 Aberrant protein expression in gastric cancer.
A: Representative image from the homeobox A10 (HOXA10) immunohistochemical assay (× 200) of gastric cancer tissue. The moderately differentiated adenocarcinoma shows positive for HOXA10 expression. A strong cytoplasmic immunoreaction was noted; B: Negative for HOXA10 expression; C: The expression pattern of 48 proteins from Reverse-phase protein array (RPPA) was depicted using a heat map. The color yellow represents relatively high expression levels and blue reflects relatively low levels.
- Citation: Lim JY, Yoon SO, Seol SY, Hong SW, Kim JW, Choi SH, Lee JS, Cho JY. Overexpression of miR-196b and HOXA10 characterize a poor-prognosis gastric cancer subtype. World J Gastroenterol 2013; 19(41): 7078-7088
- URL: https://www.wjgnet.com/1007-9327/full/v19/i41/7078.htm
- DOI: https://dx.doi.org/10.3748/wjg.v19.i41.7078


