Copyright
©2013 Baishideng Publishing Group Co.
World J Gastroenterol. Oct 7, 2013; 19(37): 6258-6264
Published online Oct 7, 2013. doi: 10.3748/wjg.v19.i37.6258
Published online Oct 7, 2013. doi: 10.3748/wjg.v19.i37.6258
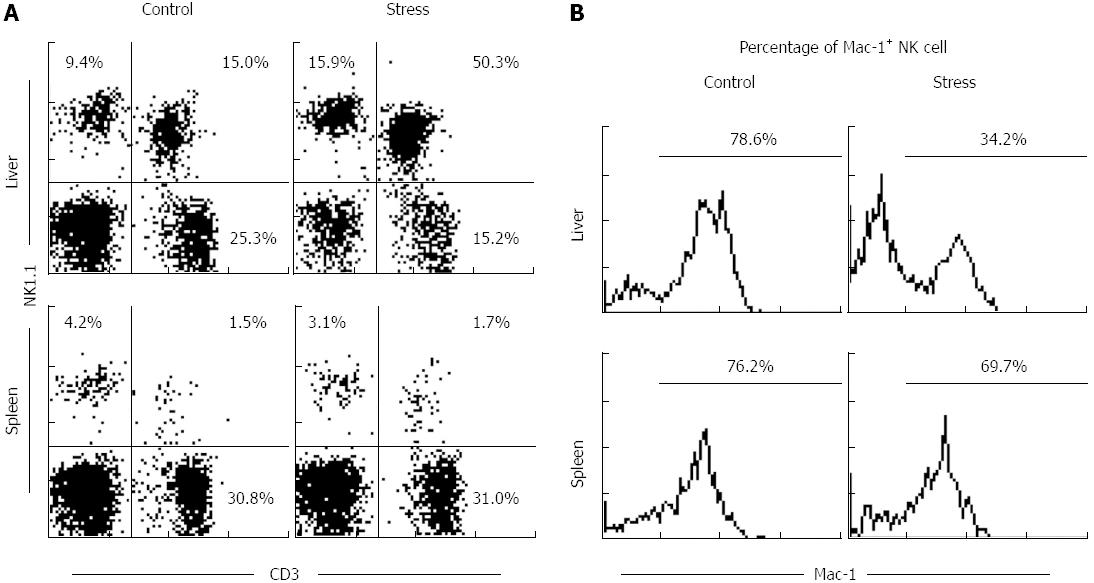
Figure 1 Percentage of natural killer cells and macrophage-1+ natural killer cells in mouse liver and spleen after 24 h of restraint stress.
A: Natural killer cells; B: Macrophage-1+ natural killer cells. NK: Natural killer; Mac-1: Macrophage-1.
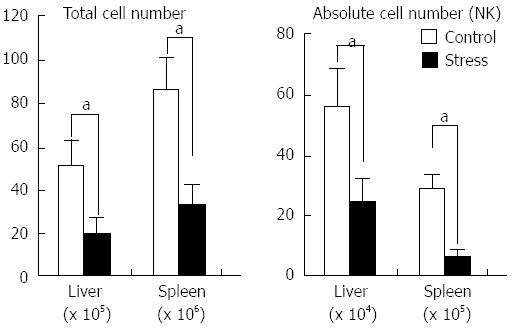
Figure 2 The number of lymphocytes and of natural killer cells in mouse liver and spleen after 24 h of restraint stress.
NK: Natural killer. aP < 0.05 vs control group.
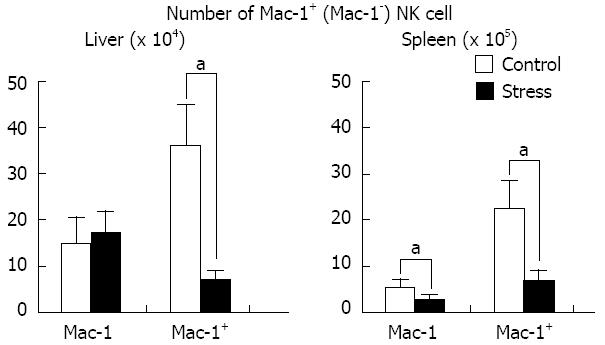
Figure 3 Determination of macrophage-1+ and macrophage-1- natural killer cells in mouse liver and spleen after 24 h of restraint stress.
Mac-1+: Macrophage-1 positive; Mac-1-: Macrophage-1 negative; NK: Natural killer. aP < 0.05 vs control group.
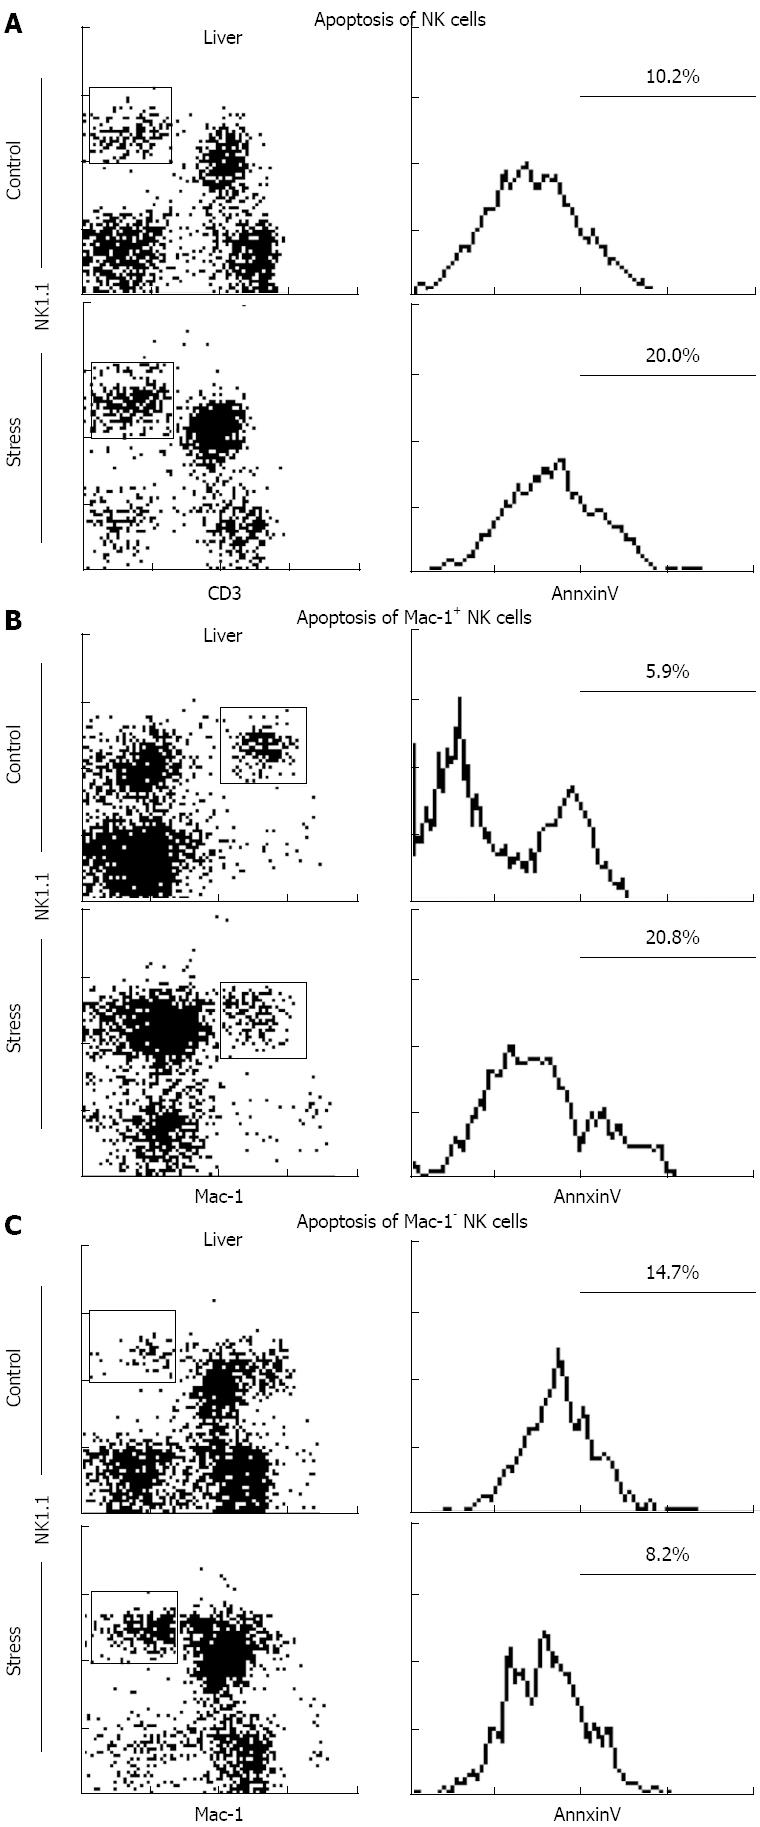
Figure 4 Apoptosis of natural killer cells after 24 h of restraint stress.
A: Apoptosis of NK cells; B: Apoptosis of Mac-1+ NK cells; C: Apoptosis of Mac-1- NK cells. NK: Natural killer; Mac-1: Macrophage-1.
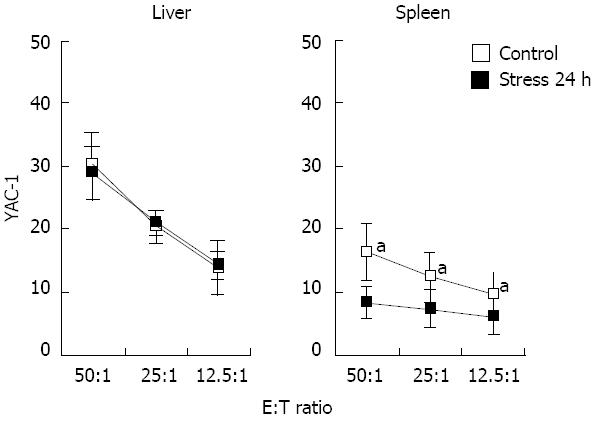
Figure 5 Cytotoxicity of natural killer cells in mouse liver and spleen after 24 h of restraint stress.
NK: Natural killer; E:T Ratio: Effector-target ratio. aP < 0.05 vs spleen after 24 h of stress.
- Citation: Ma Z, Liu Y, Zhou X, Yu HL, Li MQ, Tomiyama-Miyaji C, Abo T, Bai XF. Research on stress-induced apoptosis of natural killer cells and the alteration of their killing activity in mouse liver. World J Gastroenterol 2013; 19(37): 6258-6264
- URL: https://www.wjgnet.com/1007-9327/full/v19/i37/6258.htm
- DOI: https://dx.doi.org/10.3748/wjg.v19.i37.6258


