Copyright
©2013 Baishideng Publishing Group Co.
World J Gastroenterol. Sep 21, 2013; 19(35): 5870-5876
Published online Sep 21, 2013. doi: 10.3748/wjg.v19.i35.5870
Published online Sep 21, 2013. doi: 10.3748/wjg.v19.i35.5870
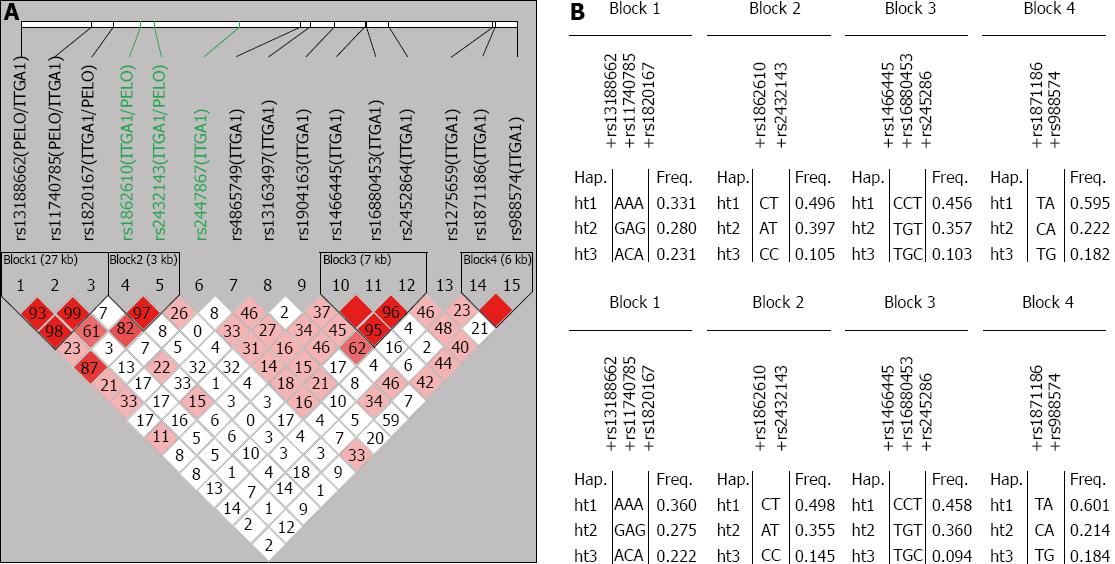
Figure 1 Haplotype linkage disequilibrium blocks and haplotype frequencies for ITGA1.
A: Linkage disequilibrium (LD) blocks among ITGA1 polymorphisms. Black squares indicate a statistically significant allelic association between a pair of single nucleotide polymorphisms, as measured by the D statistic; darker gray indicate higher values of D; B: Haplotype frequencies of ITGA1 polymorphisms in cases (top) and controls (bottom).
-
Citation: Yim DH, Zhang YW, Eom SY, Moon SI, Yun HY, Song YJ, Youn SJ, Hyun T, Park JS, Kim BS, Lee JY, Kim YD, Kim H.
ITGA1 polymorphisms and haplotypes are associated with gastric cancer risk in a Korean population. World J Gastroenterol 2013; 19(35): 5870-5876 - URL: https://www.wjgnet.com/1007-9327/full/v19/i35/5870.htm
- DOI: https://dx.doi.org/10.3748/wjg.v19.i35.5870


