Copyright
©2013 Baishideng Publishing Group Co.
World J Gastroenterol. Sep 21, 2013; 19(35): 5828-5836
Published online Sep 21, 2013. doi: 10.3748/wjg.v19.i35.5828
Published online Sep 21, 2013. doi: 10.3748/wjg.v19.i35.5828
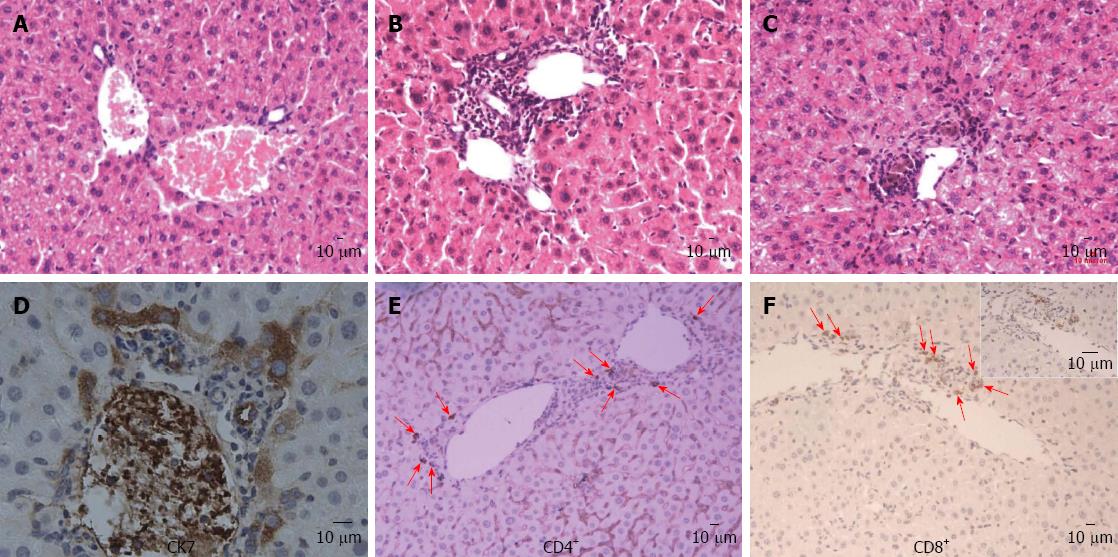
Figure 1 Histological features of the liver.
A: Control mice; B-F: Mice model; B: Lymphocytic infiltration (red arrows) around the small bile ducts within the portal tracts at week 8; C: Bile plugs were seen in canaliculi at week 24; D: CK-7 expression in periportal proliferated bile ductile and intralobular hepatocytes; E: CD4+ lymphocytes infiltration; F: CD8+ lymphocytes infiltration (bar 10 μm).
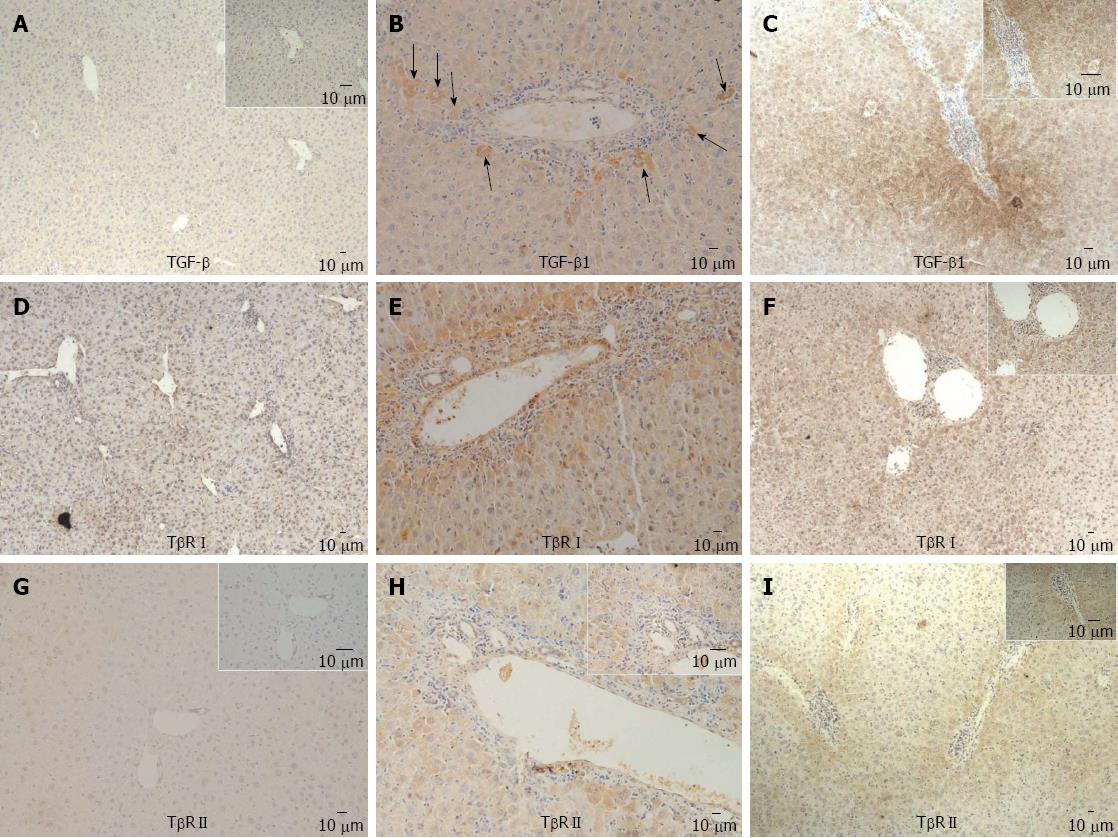
Figure 2 Expressions of transforming growth factor-β1, transforming growth factor-β receptor I, transforming growth factor-β receptor II in liver.
A, D and G: Control mice; B, C, E, F, H and I: Mouse model; A-C: Transforming growth factor-β1 (TGF-β) expression; D-F: TGF-β receptor I (TβRI) expression; G-I: Transforming growth factor-β receptor II expression (bar 10 μm).
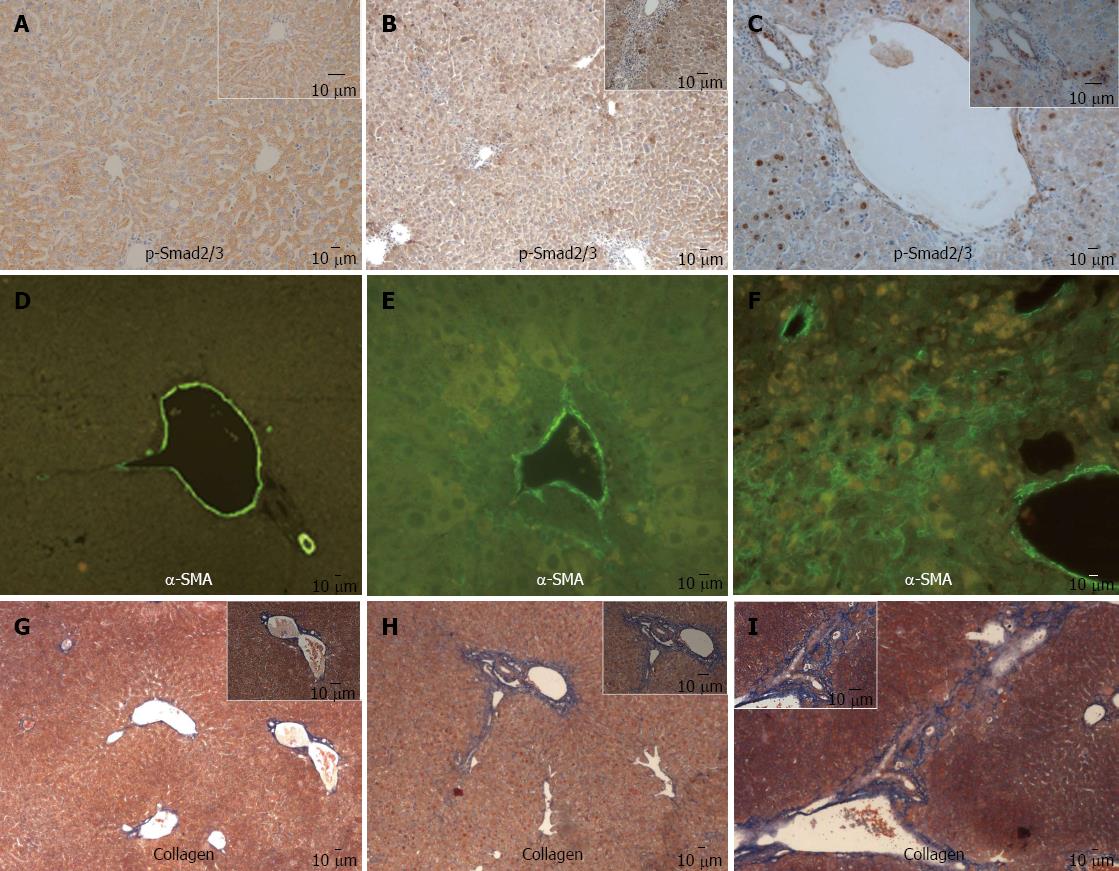
Figure 3 Expression of p-Smad2/3, α-smooth muscle actin antibody and collagen in liver.
A, D and G: Control mice; B, C, E, F, H and I: Mouse model. A-C: p-Smad2/3 expression; D-F: α-smooth muscle actin (α-SMA) antibody expression; G-I: Collagen expression (bar 10 μm).
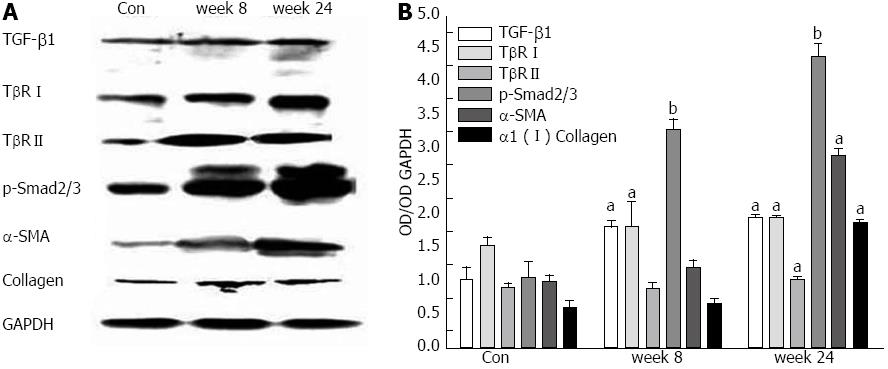
Figure 4 Immunoblot of transforming growth factor-β1, transforming growth factor-β receptor I, transforming growth factor-β receptor II, p-Smad2/3, α-smooth muscle actin antibody and α1 (I) collagen.
A: Western blotting analyses of transforming growth factor (TGF)-β1, TGF-β receptor I (TβRI), TβRII, pSmad2/3, α-smooth muscle actin (SMA) antibody and α1 (I) collagen expression of the liver homogenates. Glyceraldehyde-3-phosphate dehydrogenase (GAPDH) was an internal control for equal loading (n = 6); B: aP < 0.05, bP < 0.01 vs control mice.
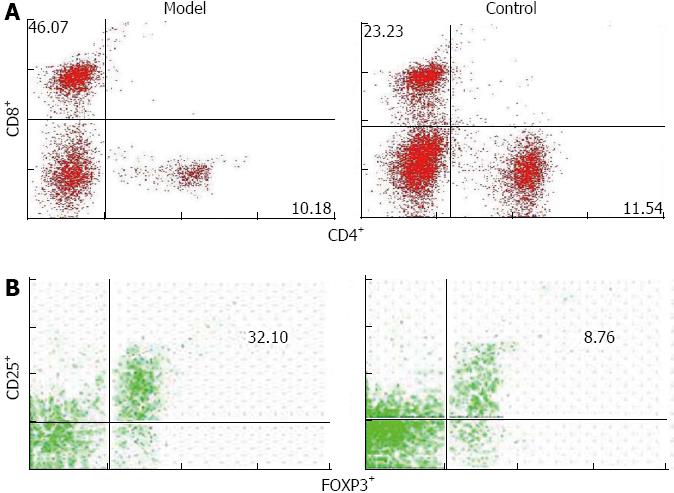
Figure 5 Lymphocytic subsets of the liver.
A: The percentage of CD4+ and CD8+ cells in total lymphocytes population in liver; B: The percentage of CD25+ FOXP3+ in CD4+ cells population in liver.
- Citation: Liu B, Zhang X, Zhang FC, Zong JB, Zhang W, Zhao Y. Aberrant TGF-β1 signaling contributes to the development of primary biliary cirrhosis in murine model. World J Gastroenterol 2013; 19(35): 5828-5836
- URL: https://www.wjgnet.com/1007-9327/full/v19/i35/5828.htm
- DOI: https://dx.doi.org/10.3748/wjg.v19.i35.5828


