Copyright
©2013 Baishideng Publishing Group Co.
World J Gastroenterol. Jul 28, 2013; 19(28): 4596-4606
Published online Jul 28, 2013. doi: 10.3748/wjg.v19.i28.4596
Published online Jul 28, 2013. doi: 10.3748/wjg.v19.i28.4596
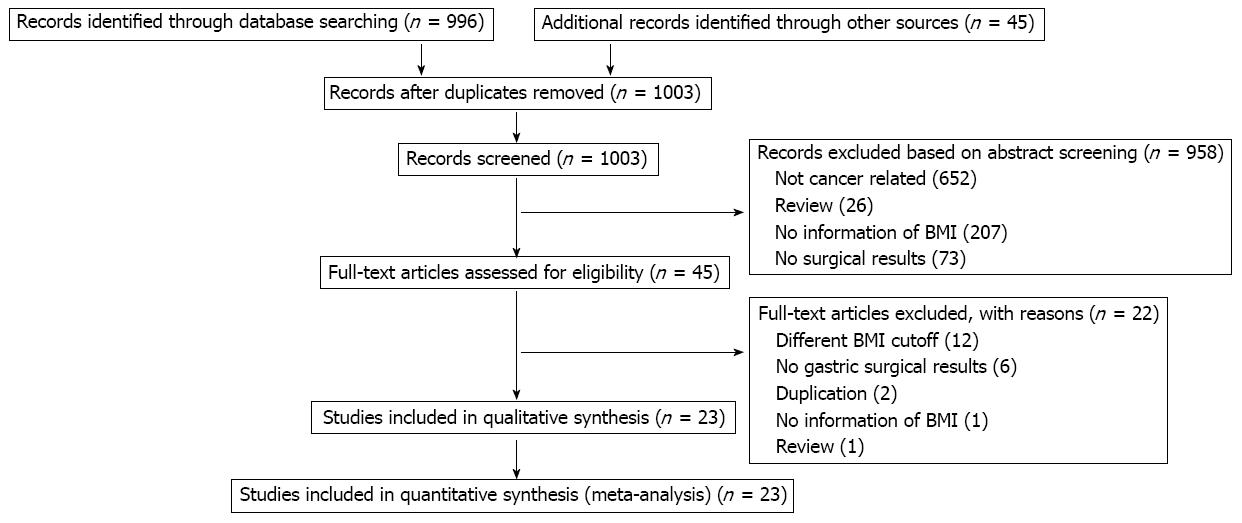
Figure 1 PRISMA flow chart showing study selection process.
BMI: Body mass index.
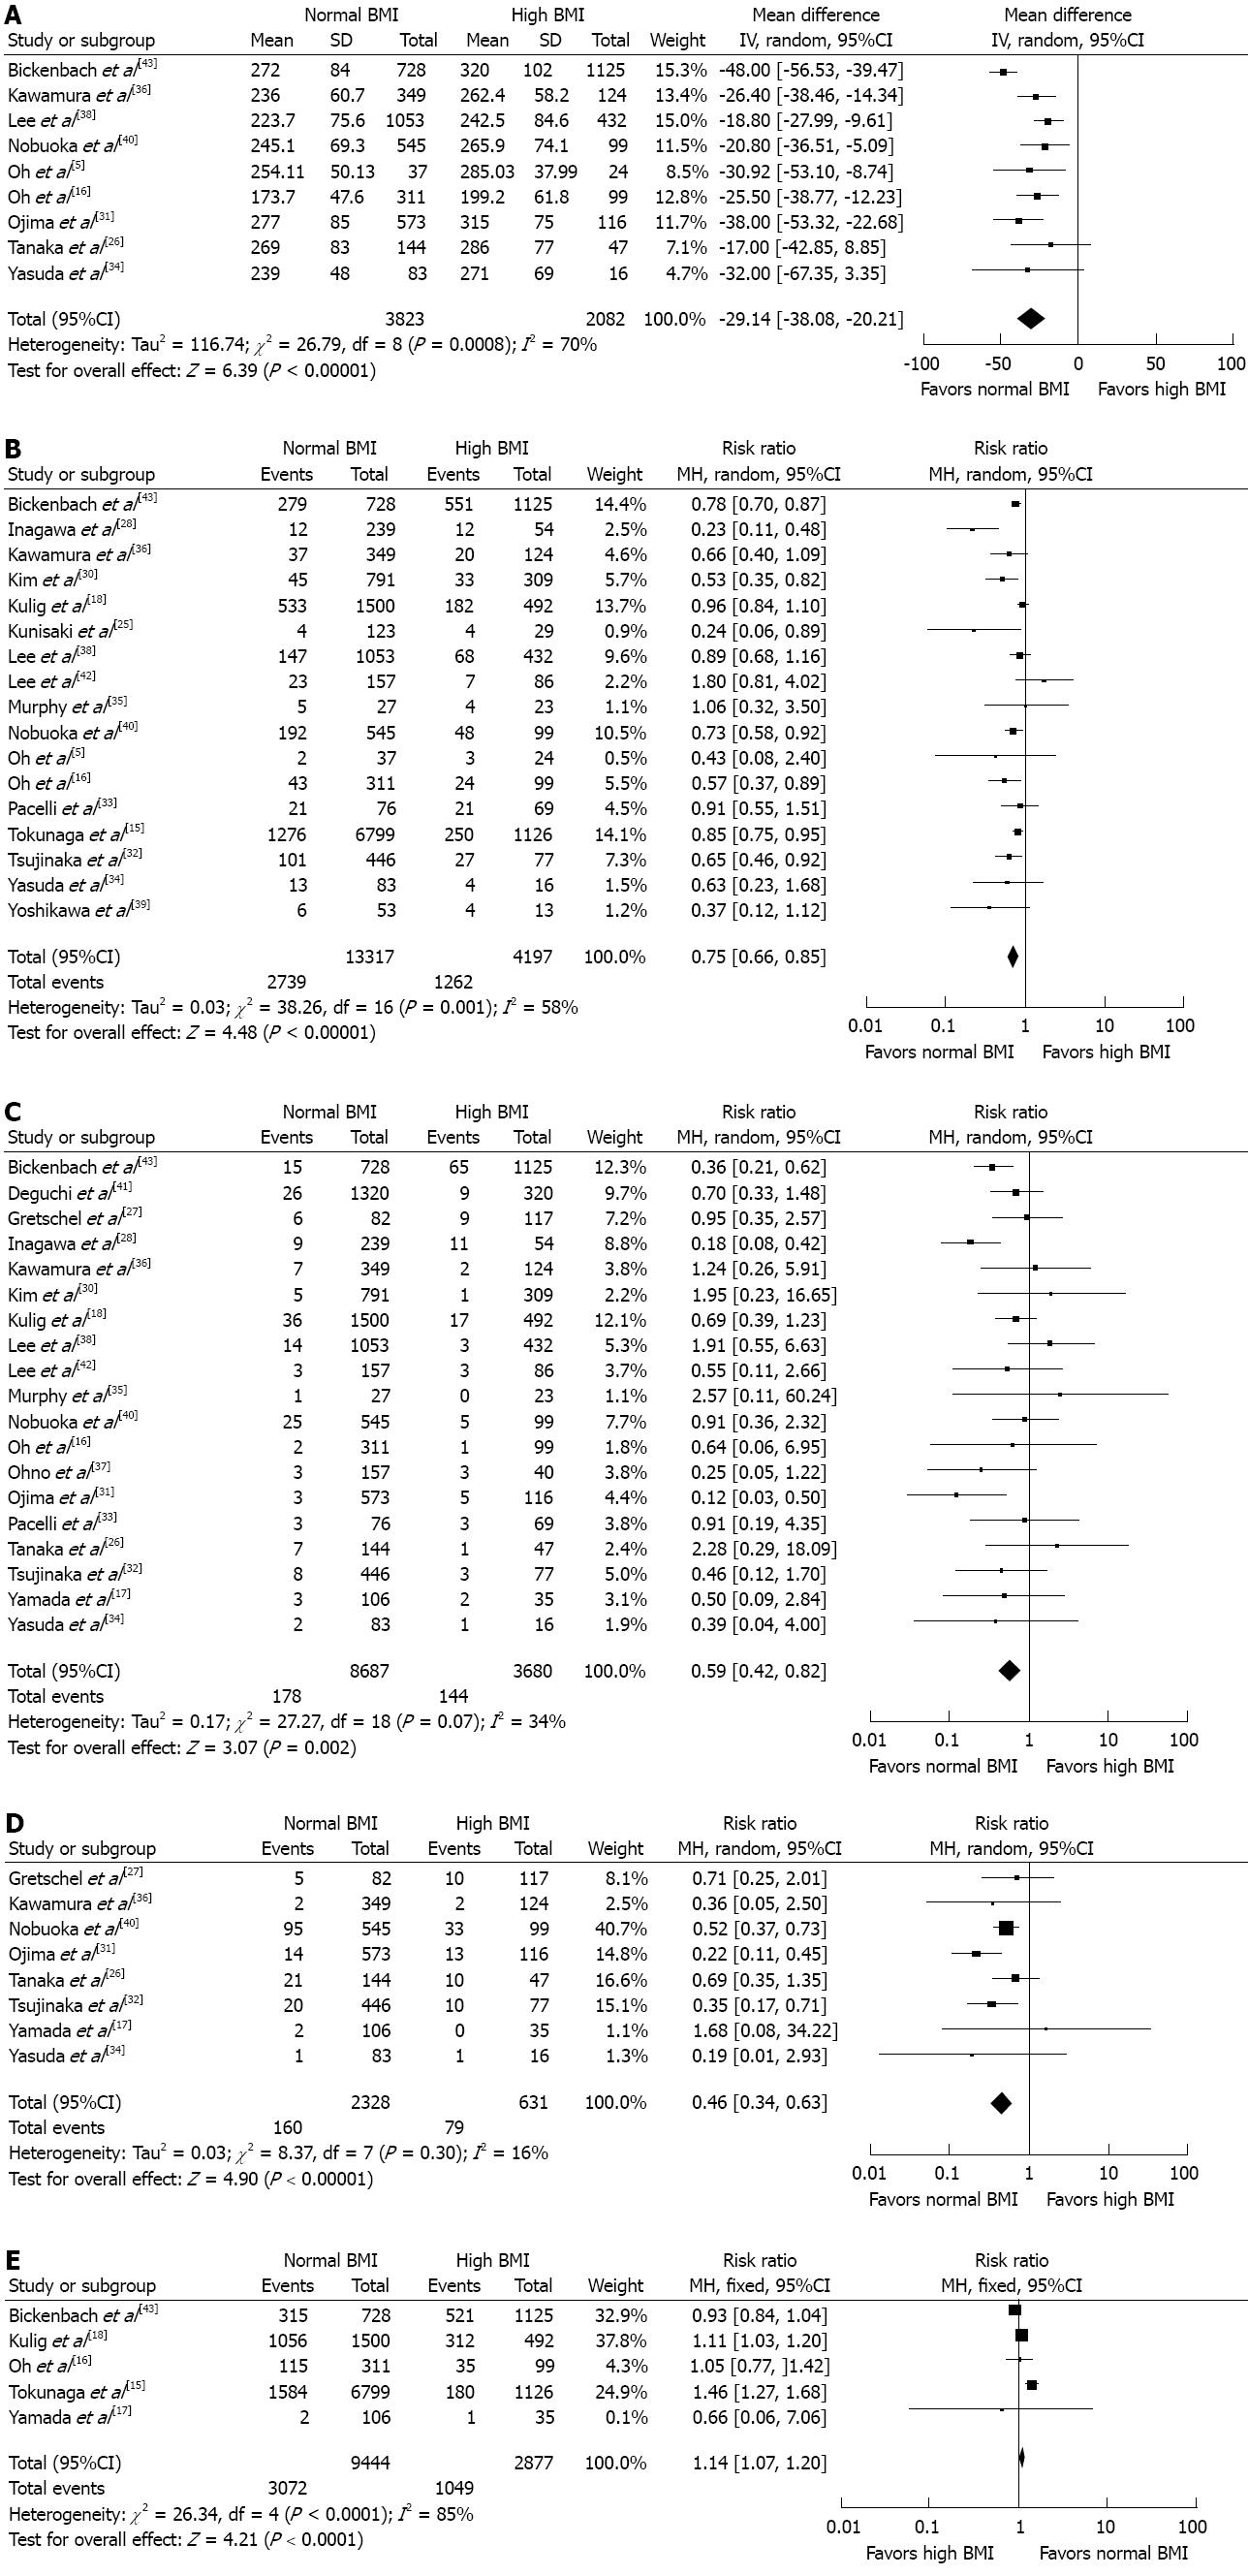
Figure 2 Forest plot.
A: For operative time showing overweight in association with longer duration of operative time than non-overweight; B: For morbidity showing overweight in association with more postoperative complication than non-overweight; C: For anastomotic leak indicating that overweight correlates with higher rate of anastomotic leak; D: For pancreatic fistula showing overweight in association with more pancreatic fistula than non-overweight; E: For long-term survival favoring normal weight with better survival results. BMI: Body mass index.
- Citation: Wu XS, Wu WG, Li ML, Yang JH, Ding QC, Zhang L, Mu JS, Gu J, Dong P, Lu JH, Liu YB. Impact of being overweight on the surgical outcomes of patients with gastric cancer: A meta-analysis. World J Gastroenterol 2013; 19(28): 4596-4606
- URL: https://www.wjgnet.com/1007-9327/full/v19/i28/4596.htm
- DOI: https://dx.doi.org/10.3748/wjg.v19.i28.4596


