Copyright
©2013 Baishideng Publishing Group Co.
World J Gastroenterol. Jun 7, 2013; 19(21): 3324-3331
Published online Jun 7, 2013. doi: 10.3748/wjg.v19.i21.3324
Published online Jun 7, 2013. doi: 10.3748/wjg.v19.i21.3324
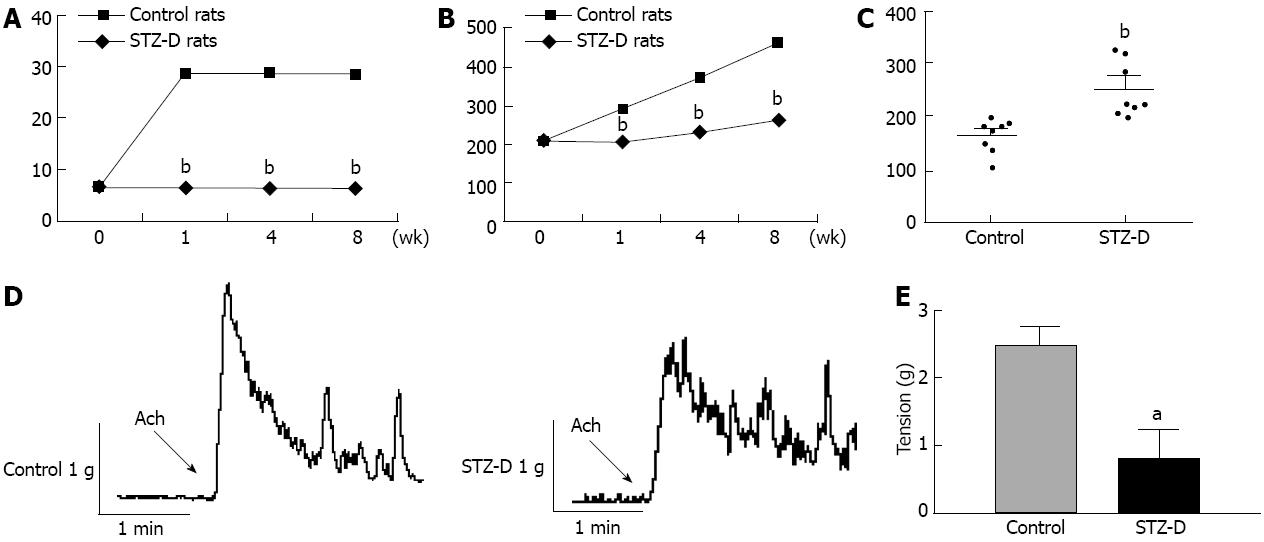
Figure 1 Colonic motility dysfunction in rats with streptozotocin-induced diabetes.
A: Blood glucose levels of control group and rats with streptozotocin (STZ)-induced diabetes (n = 8); B: The body weights of diabetic and age-matched control rats (n = 8); C: Colonic transit time in STZ-D and control rats 8 wk after STZ injection (n = 8); D: Circular muscle strip contractility from the representative distal colon of an STZ-D rats and control 8 wk after STZ injection and exposed to 1 μmol/L Ach. Representative images are shown; E: Quantification of maximum contractile force of a circular muscle strip stimulated by 1 μmol/L Ach (n = 8). aP < 0.05, bP < 0.01 vs the control group.
Figure 2 Stem cell factor and insulin-like growth factor-1 expression in streptozotocin-D rat distal colon.
A: Stem cell factor (SCF) and insulin-like growth factor-1 (IGF-1) protein levels in streptozotocin (STZ)-D rat distal colon (n = 8). Images are representative of at least 4 independent Western blotting, glyceraldehyde-3-phosphate dehydrogenase (GAPDH) was used as a loading control; B: SCF and IGF-1 mRNA levels in colonic tissue of control rats and STZ-D rats (n = 8). aP < 0.05, bP < 0.01 vs the control group.
Figure 3 Effects of insulin-like growth factor-1 siRNA on stem cell factor expression.
A: Effects on stem cell factor (SCF) mRNA levels in colonic smooth muscle cells (SMCs) 72 h after of transfection with insulin-like growth factor-1 (IGF-1) siRNA (Each bar represents the mean ± SE of 3 independent experiments). aP < 0.05, bP < 0.01 vs controls; cP < 0.05, dP < 0.01 vs negative controls; B: SCF protein expression in SMCs after IGF-1 knockdown for 72 h (figure is representative of 3 experiments). α-Tubulin was used as a loading control.
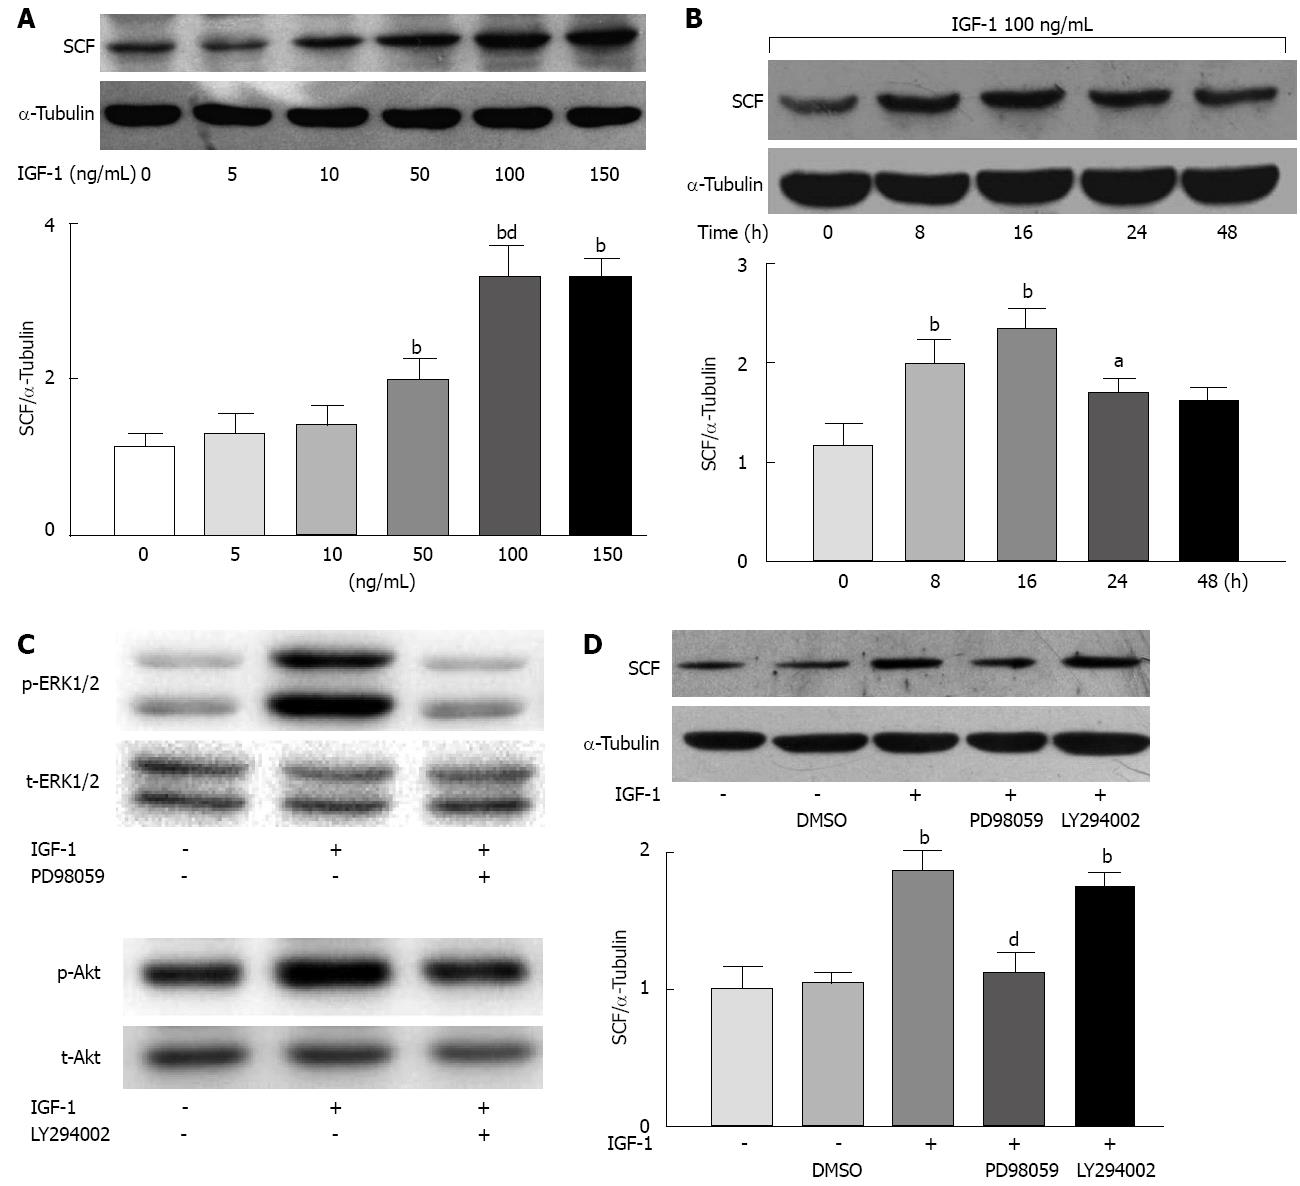
Figure 4 Insulin-like growth factor-1-induced stem cell factor expression through the extracellular-signal-regulated kinase 1/2 pathway in smooth muscle cells.
A: Insulin-like growth factor-1 (IGF-1) effects on the expression of stem cell factor (SCF) as a function of concentration after treatment with IGF-1 for 24 h. bP < 0.01 vs 0 ng/mL IGF-1; dP < 0.01 vs 50 ng/mL IGF-1; B: IGF-1 effects on SCF expression as a function of time. aP < 0.05, bP < 0.01 vs 0 h; C: Phosphorylation of extracellular-signal-regulated kinase 1/2 (ERK1/2) and Akt after 100 ng/mL IGF-1 treatment for 15 min; D: Effects of PD98059 and LY294002 on SCF expression by IGF-1 treatment. bP < 0.01 vs the no treatment group; dP < 0.01 vs IGF-1 treatment group. Western blotting represent 3 independent experiments. α-Tubulin was used as a loading control (each bar represents the mean ± SE of 3 independent experiments).
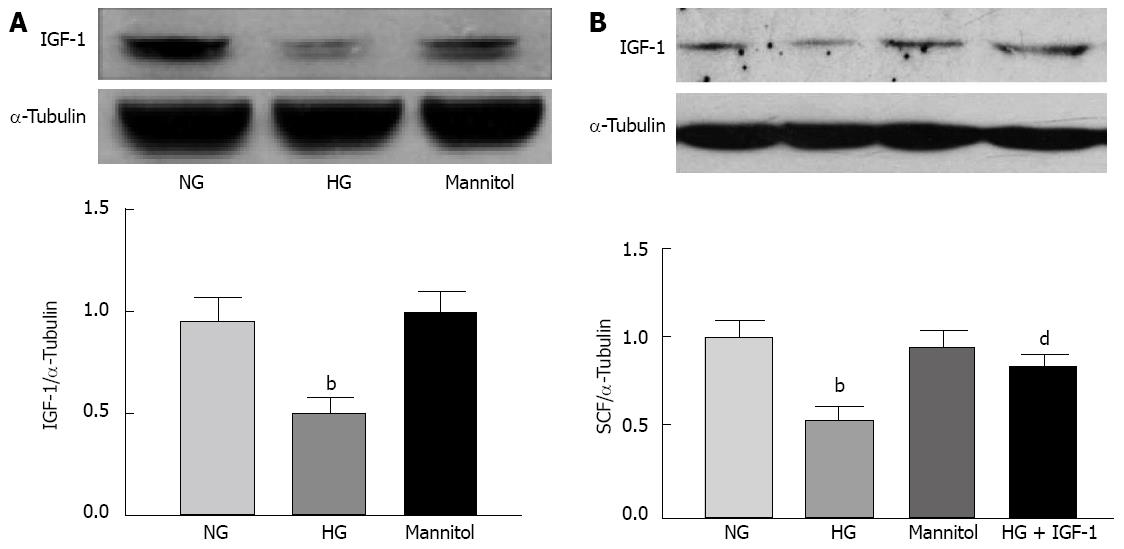
Figure 5 High glucose inhibited endogenous insulin-like growth factor-1 and stem cell factor expression.
A: Expression of endogenous insulin-like growth factor-1 (IGF-1) in SMCs cultured in a high glucose (HG) medium for 24 h. bP < 0.01 vs the normal glucose (NG) group; B: Stem cell factor (SCF) expression in smooth muscle cells (SMCs) exposed to HG, and effects of the addition of exogenous IGF-1 (100 ng/mL). bP < 0.01 vs the NG group; and dP < 0.01 vs HG group. The Western blotting are representatives of 4 independent experiments. α-Tubulin was used as a loading control (each bar represents the mean ± SE of 3 independent experiments).
- Citation: Wang Y, Xu XY, Tang YR, Yang WW, Yuan YF, Ning YJ, Yu YJ, Lin L. Effect of endogenous insulin-like growth factor and stem cell factor on diabetic colonic dysmotility. World J Gastroenterol 2013; 19(21): 3324-3331
- URL: https://www.wjgnet.com/1007-9327/full/v19/i21/3324.htm
- DOI: https://dx.doi.org/10.3748/wjg.v19.i21.3324


