Copyright
©2013 Baishideng Publishing Group Co.
World J Gastroenterol. Jun 7, 2013; 19(21): 3226-3240
Published online Jun 7, 2013. doi: 10.3748/wjg.v19.i21.3226
Published online Jun 7, 2013. doi: 10.3748/wjg.v19.i21.3226
Figure 1 Proliferation of AGS cells exposed to different concentrations of trichostatin A for 72 h.
A: AGS cells after treatment with 0 μmol/L trichostatin A (TSA); B and C: AGS cells were significantly reduced after exposed to 0.25 μmol/L TSA (B) and further reduced after treated with 0.5 μmol/L TSA (C).
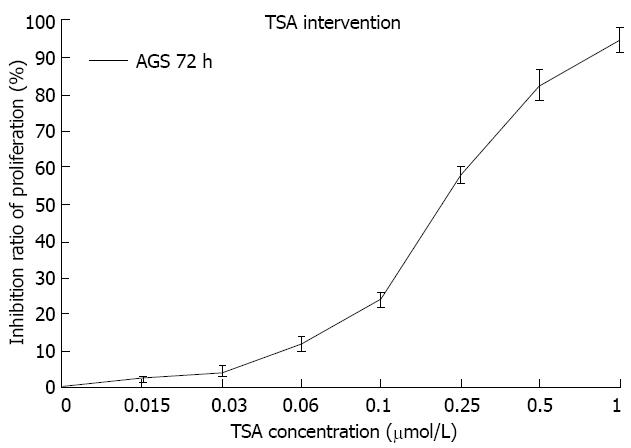
Figure 2 Effect of different concentrations of trichostatin A on inhibition of AGS cell proliferation in the cell counting kit-8 experiment.
The inhibition of AGS cells was gradually increased with increasing trichostatin A concentration 0, 0.015, 0.03, 0.06, 0.1, 0.25, 0.5 and 1 μmol/L. TSA: Trichostatin A.
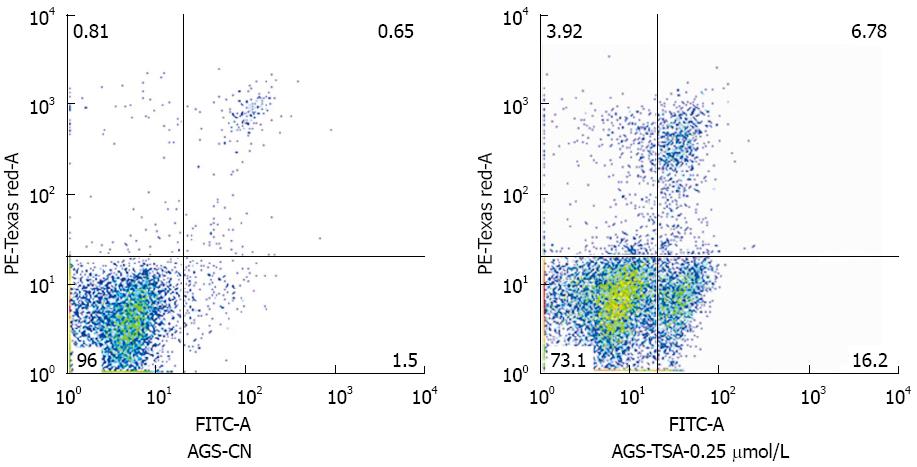
Figure 3 AGS cell apoptosis changes before and after trichostatin A exposure by flow cytometry.
Fluorescence staining was mainly seen in normal areas, but rarely in apoptotic and necrotic areas of unexposed AGS cells; staining appeared in the apoptotic and necrotic areas of AGS cells exposed to 0.25 μmol/L trichostatin A (TSA).
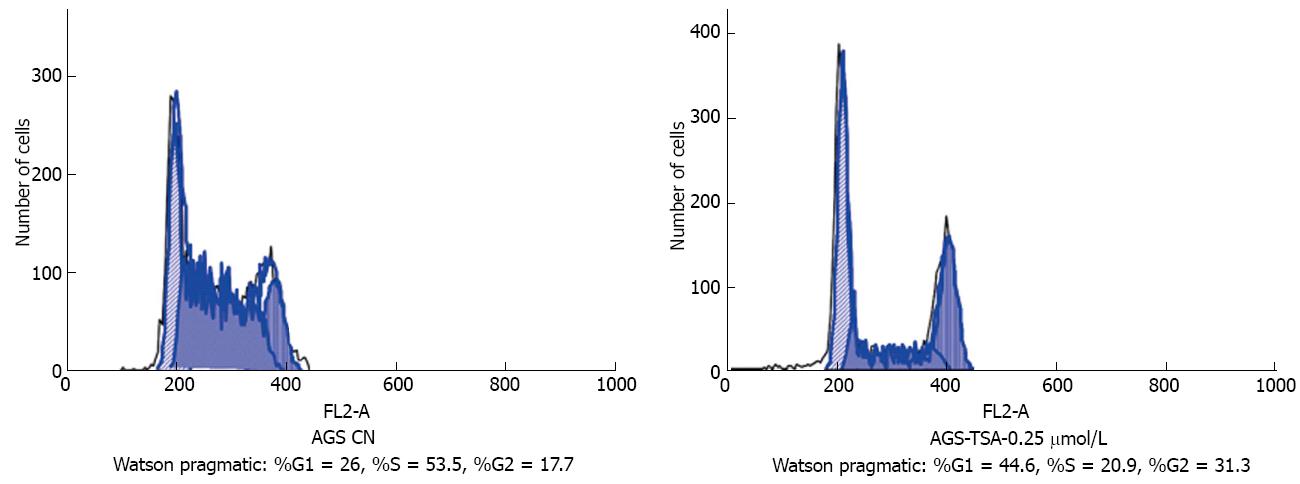
Figure 4 AGS cell cycle changes before and after trichostatin A exposure by flow cytometry.
The AGS cell cycle ratio before TSA treatment was: %G1 = 26, %S = 53.5, %G2 = 17.7, and the AGS cell cycle ratio after 0.25 μmol/L trichostatin A treatment was: %G1 = 44.6, %S = 20.9, %G2 = 31.3. Cycle arrest occurred in G0/G1, G2/M phases, especially in G0/G1 phase. TSA: Trichostatin A.
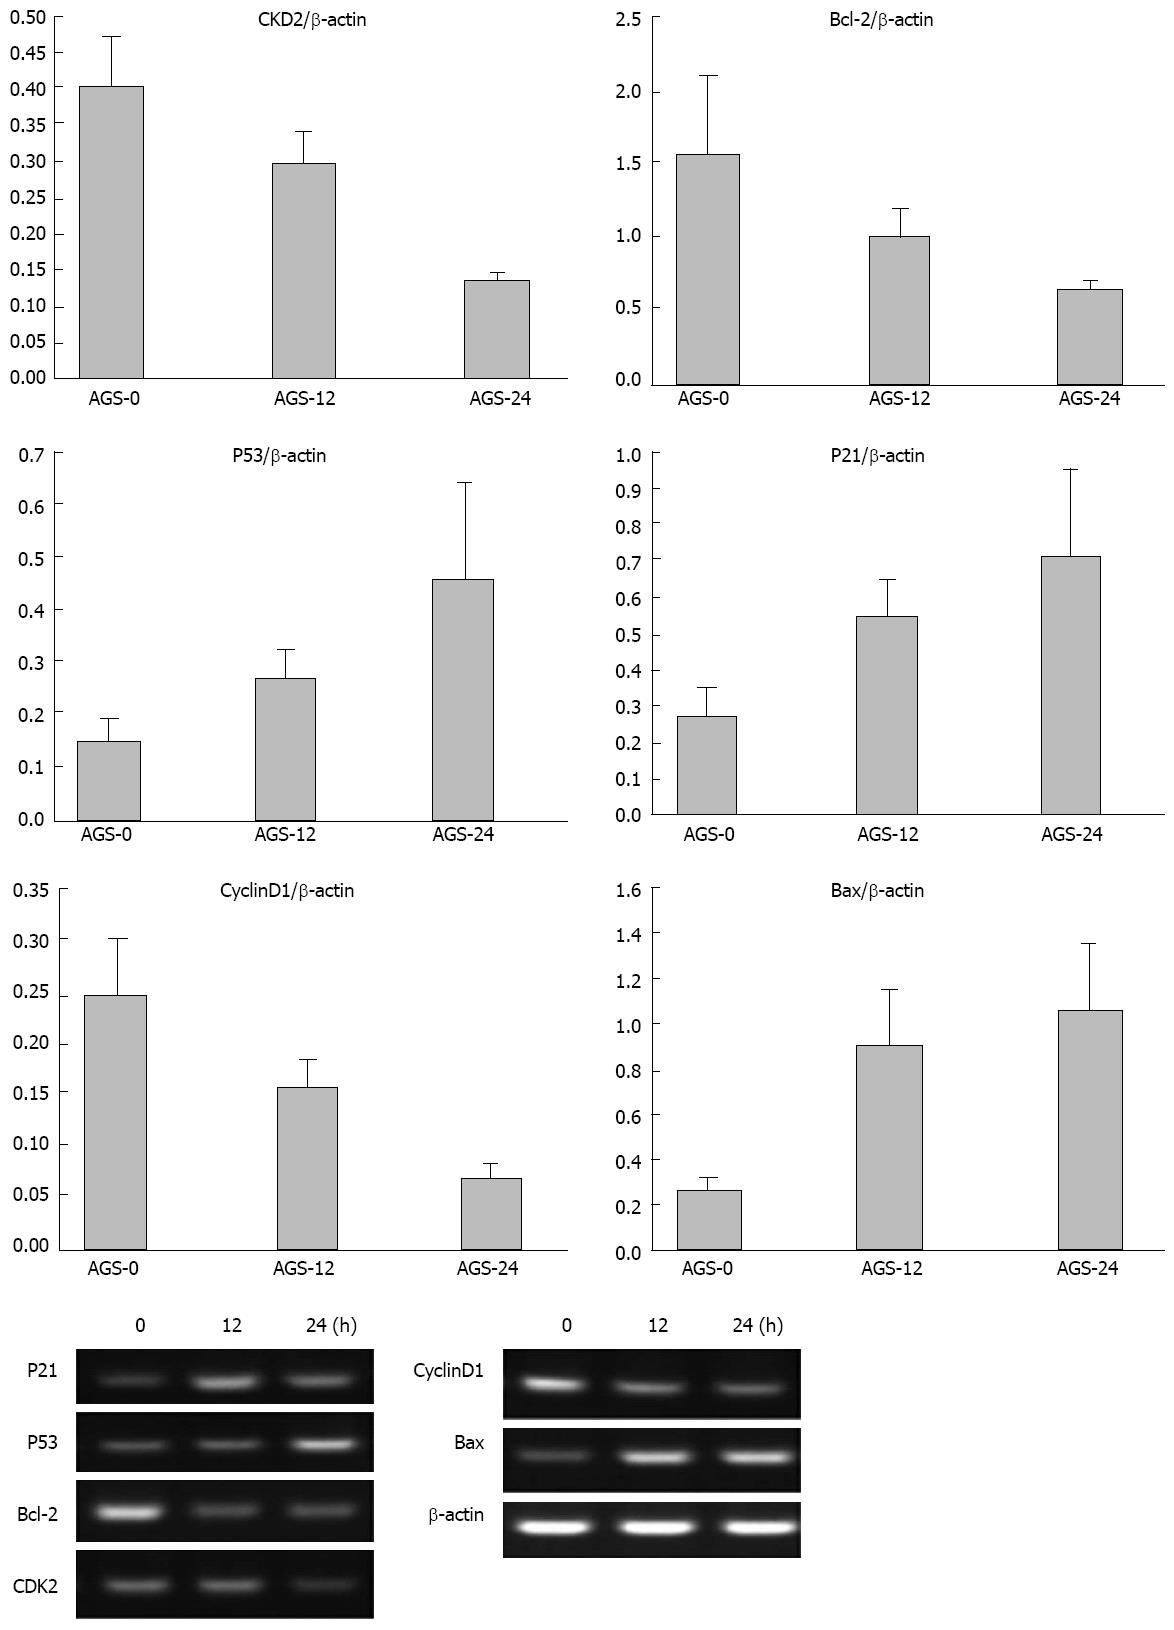
Figure 5 mRNA expression levels of p21, p53, Bax, Bcl-2, CDK2 and CyclinD1 in AGS cells exposed to 0.
25 μmol/L trichostatin A shown by real-time polymerase chain reaction. The mRNA expression levels of Bcl-2, CDK2 and CyclinD1 were decreased and the mRNA expression levels of p21, p53 and Bax were increased 12 h after AGS cells were exposed to 0.25 μmol/L trichostatin A. The mRNA expression levels of Bcl-2, CDK2 and CyclinD1 were further decreased and the mRNA expression levels of p21, p53 and Bax were further increased 24 h after exposure.
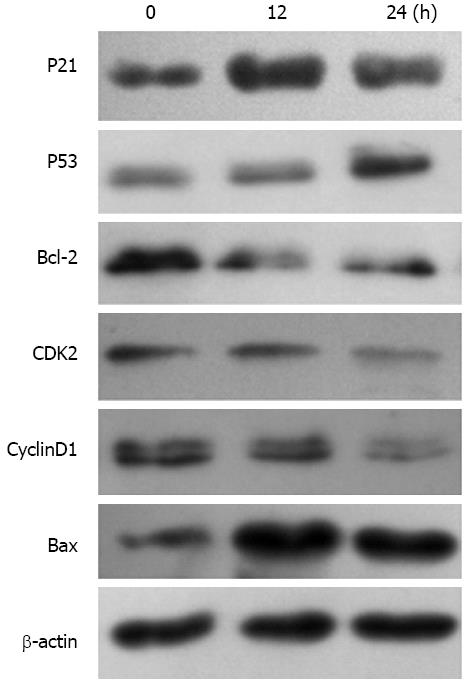
Figure 6 Protein expression levels of p21, p53, Bax, Bcl-2, CDK and cyclin after AGS cells were exposed to 0.
25 μmol/L trichostatin A shown by Western blotting. The protein expression levels of Bcl-2, CDK2 and CyclinD1 were decreased and the protein expression levels of p21, p53 and Bax were increased 12 h after AGS cells were exposed to 0.25 μmol/L trichostatin A. The protein expression levels of Bcl-2, CDK2 and CyclinD1 were further decreased and the protein expression levels of p21, p53 and Bax were further increased 24 h after exposure.
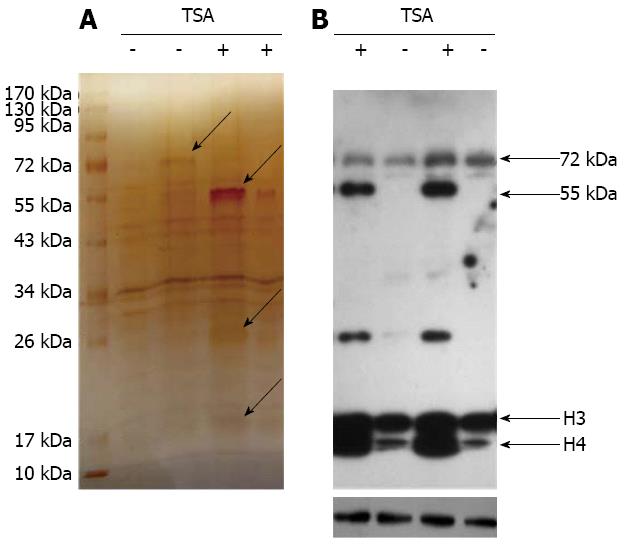
Figure 7 Identification of differential proteins of lysine acetylation after trichostatin A treatment.
A: Silver staining showed the differential proteins of lysine acetylation in AGS cells after trichostatin A (TSA) treatment; B: Western blotting showed the differential proteins of lysine acetylation in AGS cells after TSA treatment, “-” before TSA intervention; “+” after TSA intervention, Acetyl-α-tubulin (Lys40) (D20G3) XP® Rabbit mAb was the primary antibody and Goat anti-rabbit IgG-HRP was the secondary antibody.
Figure 8 Identification of the effectiveness of lysine-acetylated antibodies enriching acetylated proteins.
Line 1: 20 μg total protein from AGS cells unexposed to trichostatin A (TSA); Line 2: 20 μg total protein from AGS cells exposed to 0.5 μmol/L TSA; Line 3: 20 μg flow-through protein from AGS cells unexposed to TSA, which was incubated with an antibody gel column; Line 4: 20 μg flow-through protein from AGS cells exposed to 0.5 μmol/L TSA, which was incubated with an antibody gel column; Line 5: 100 ng enriched protein from AGS cells unexposed to TSA, which was incubated with an antibody gel column; and Line 6: 100 ng enriched protein from AGS cells exposed to 0.5 μmol/L TSA, which was incubated with an antibody gel column.
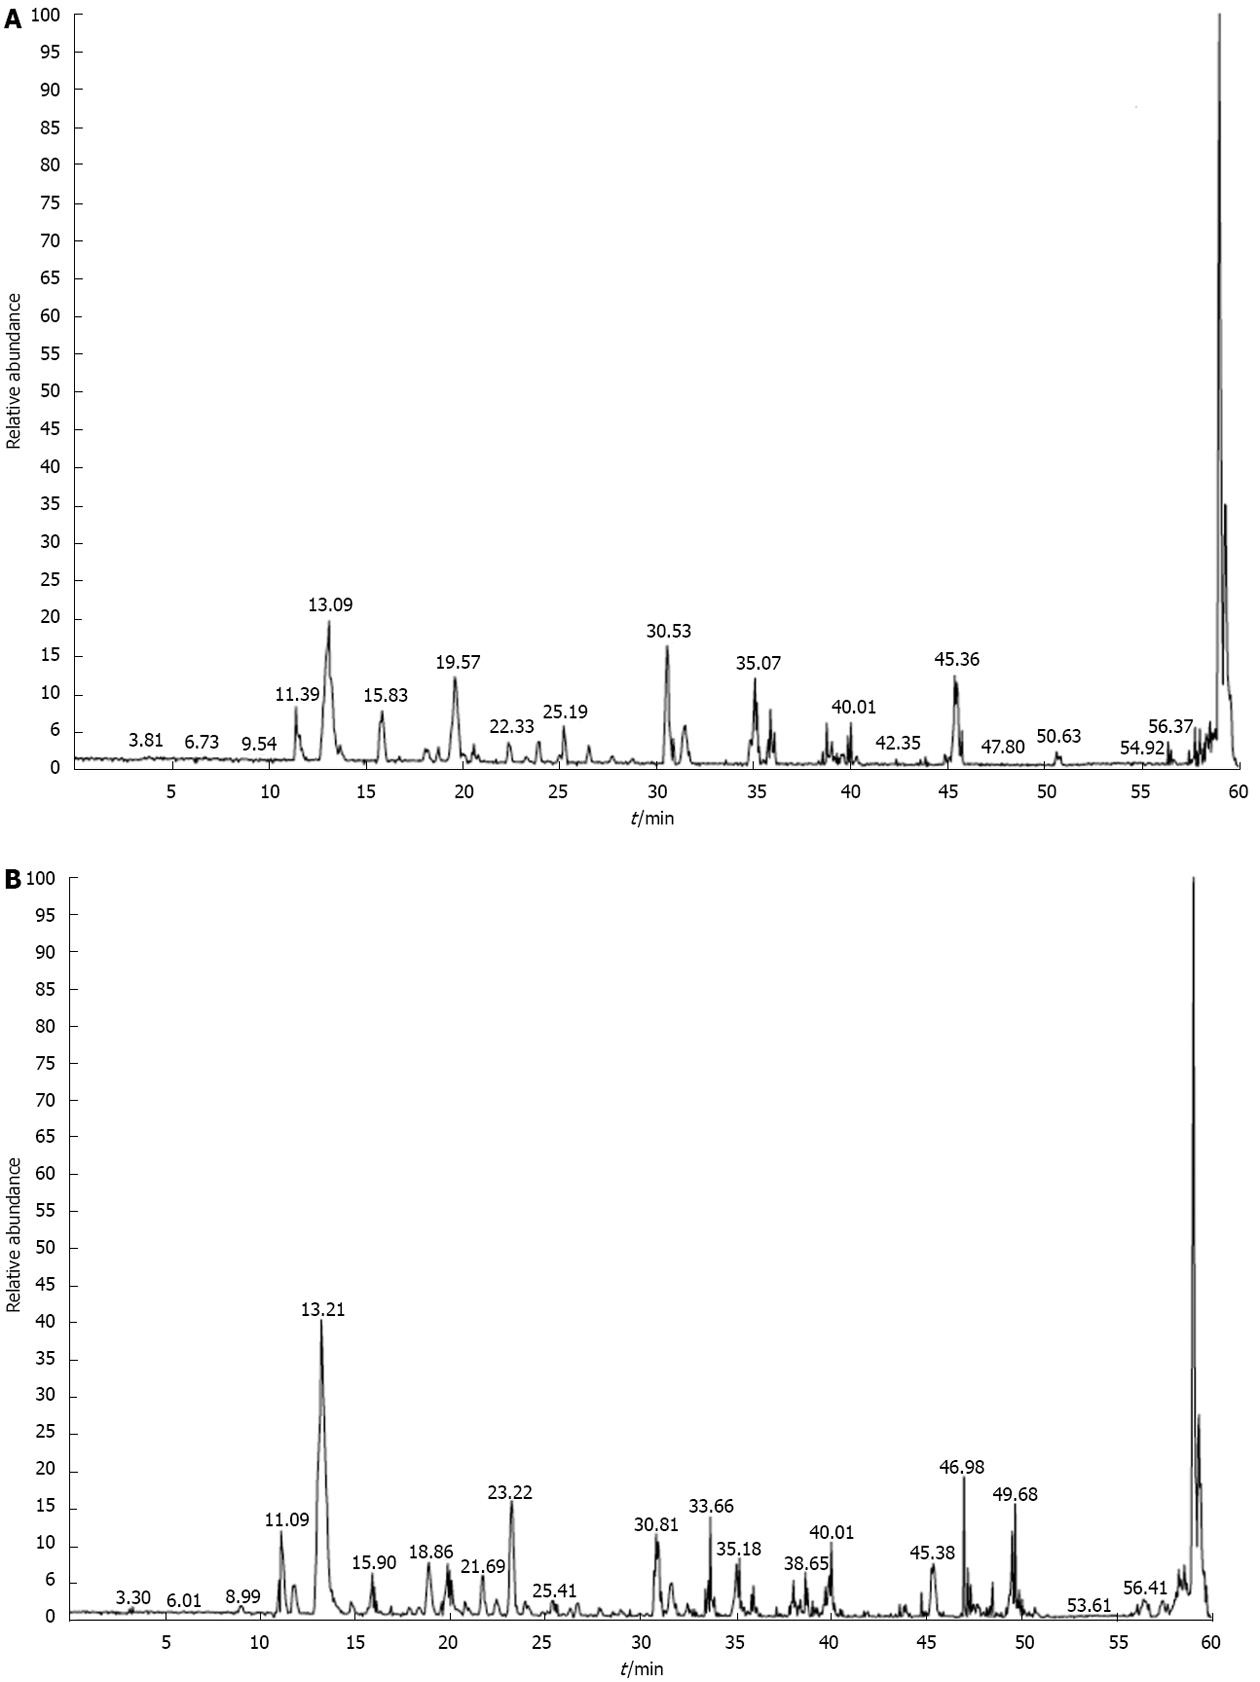
Figure 9 Mass spectrometry total ion chromatography.
A: 72 kDa band of lysine-acetylated protein in AGS cells before trichostatin A (TSA) treatment; B: 28 kDa band of lysine-acetylated protein in AGS cells after TSA treatment.
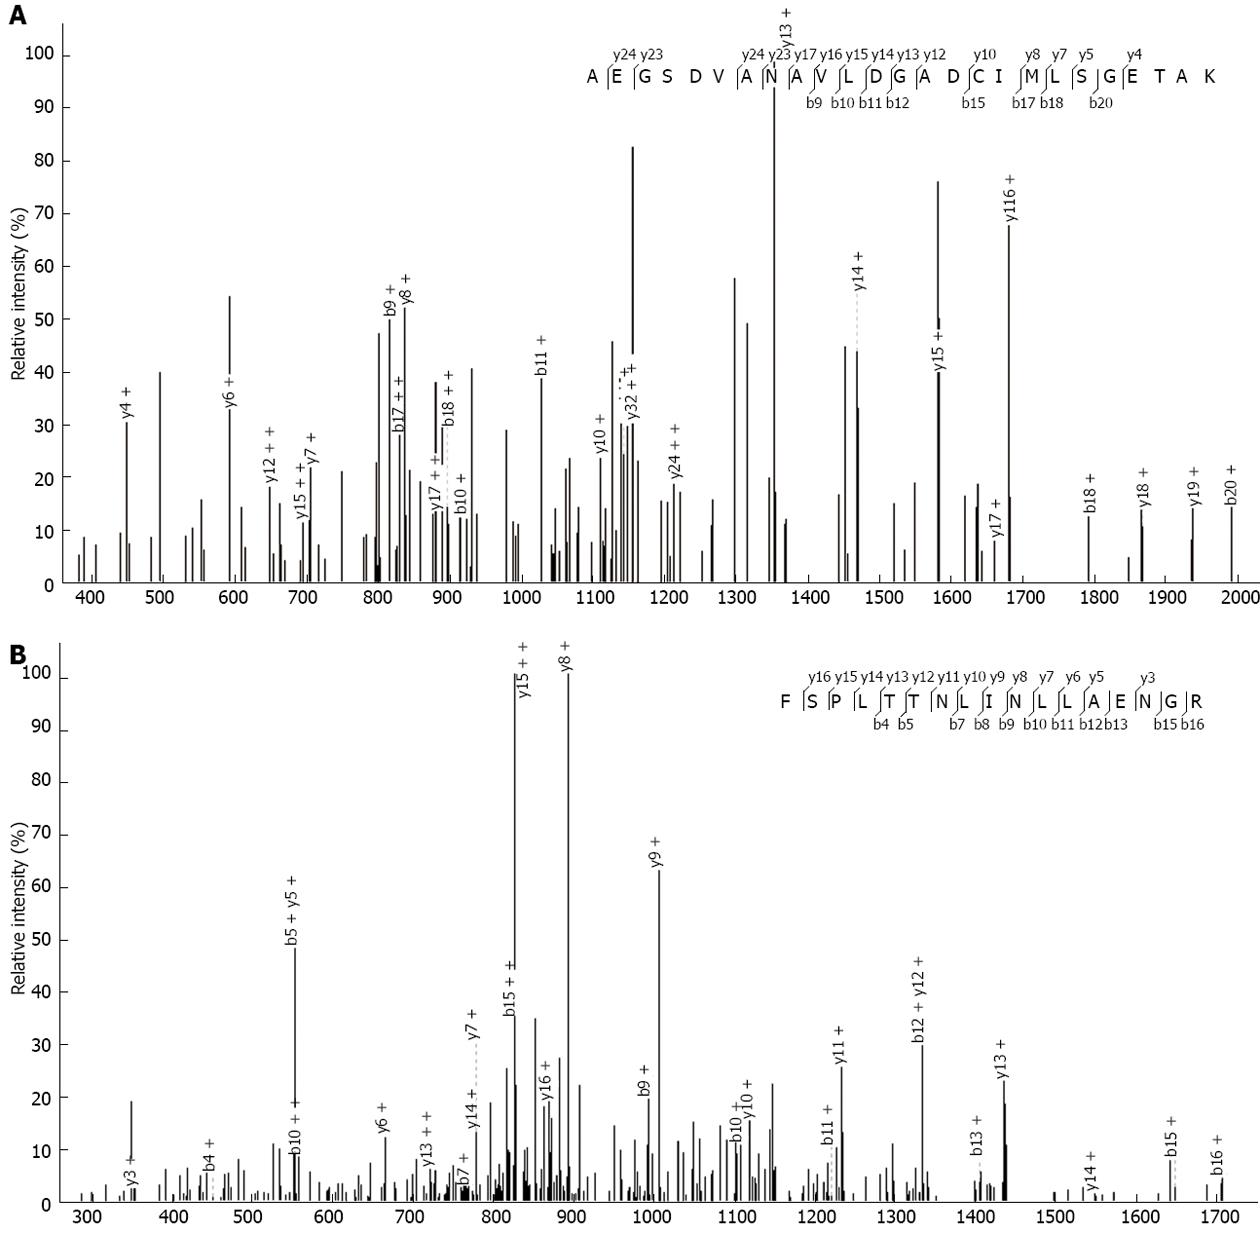
Figure 10 Mass spectrometry identification of peptides from silver staining gel.
Mass spectra of 2 acetylated peptides from PKM2 and ATP5O are presented. A: PKM2 “AEGSDVANAVLDGADCIMLSGETAK”; B: ATP5O “FSPLTTNLINLLAENGR”.
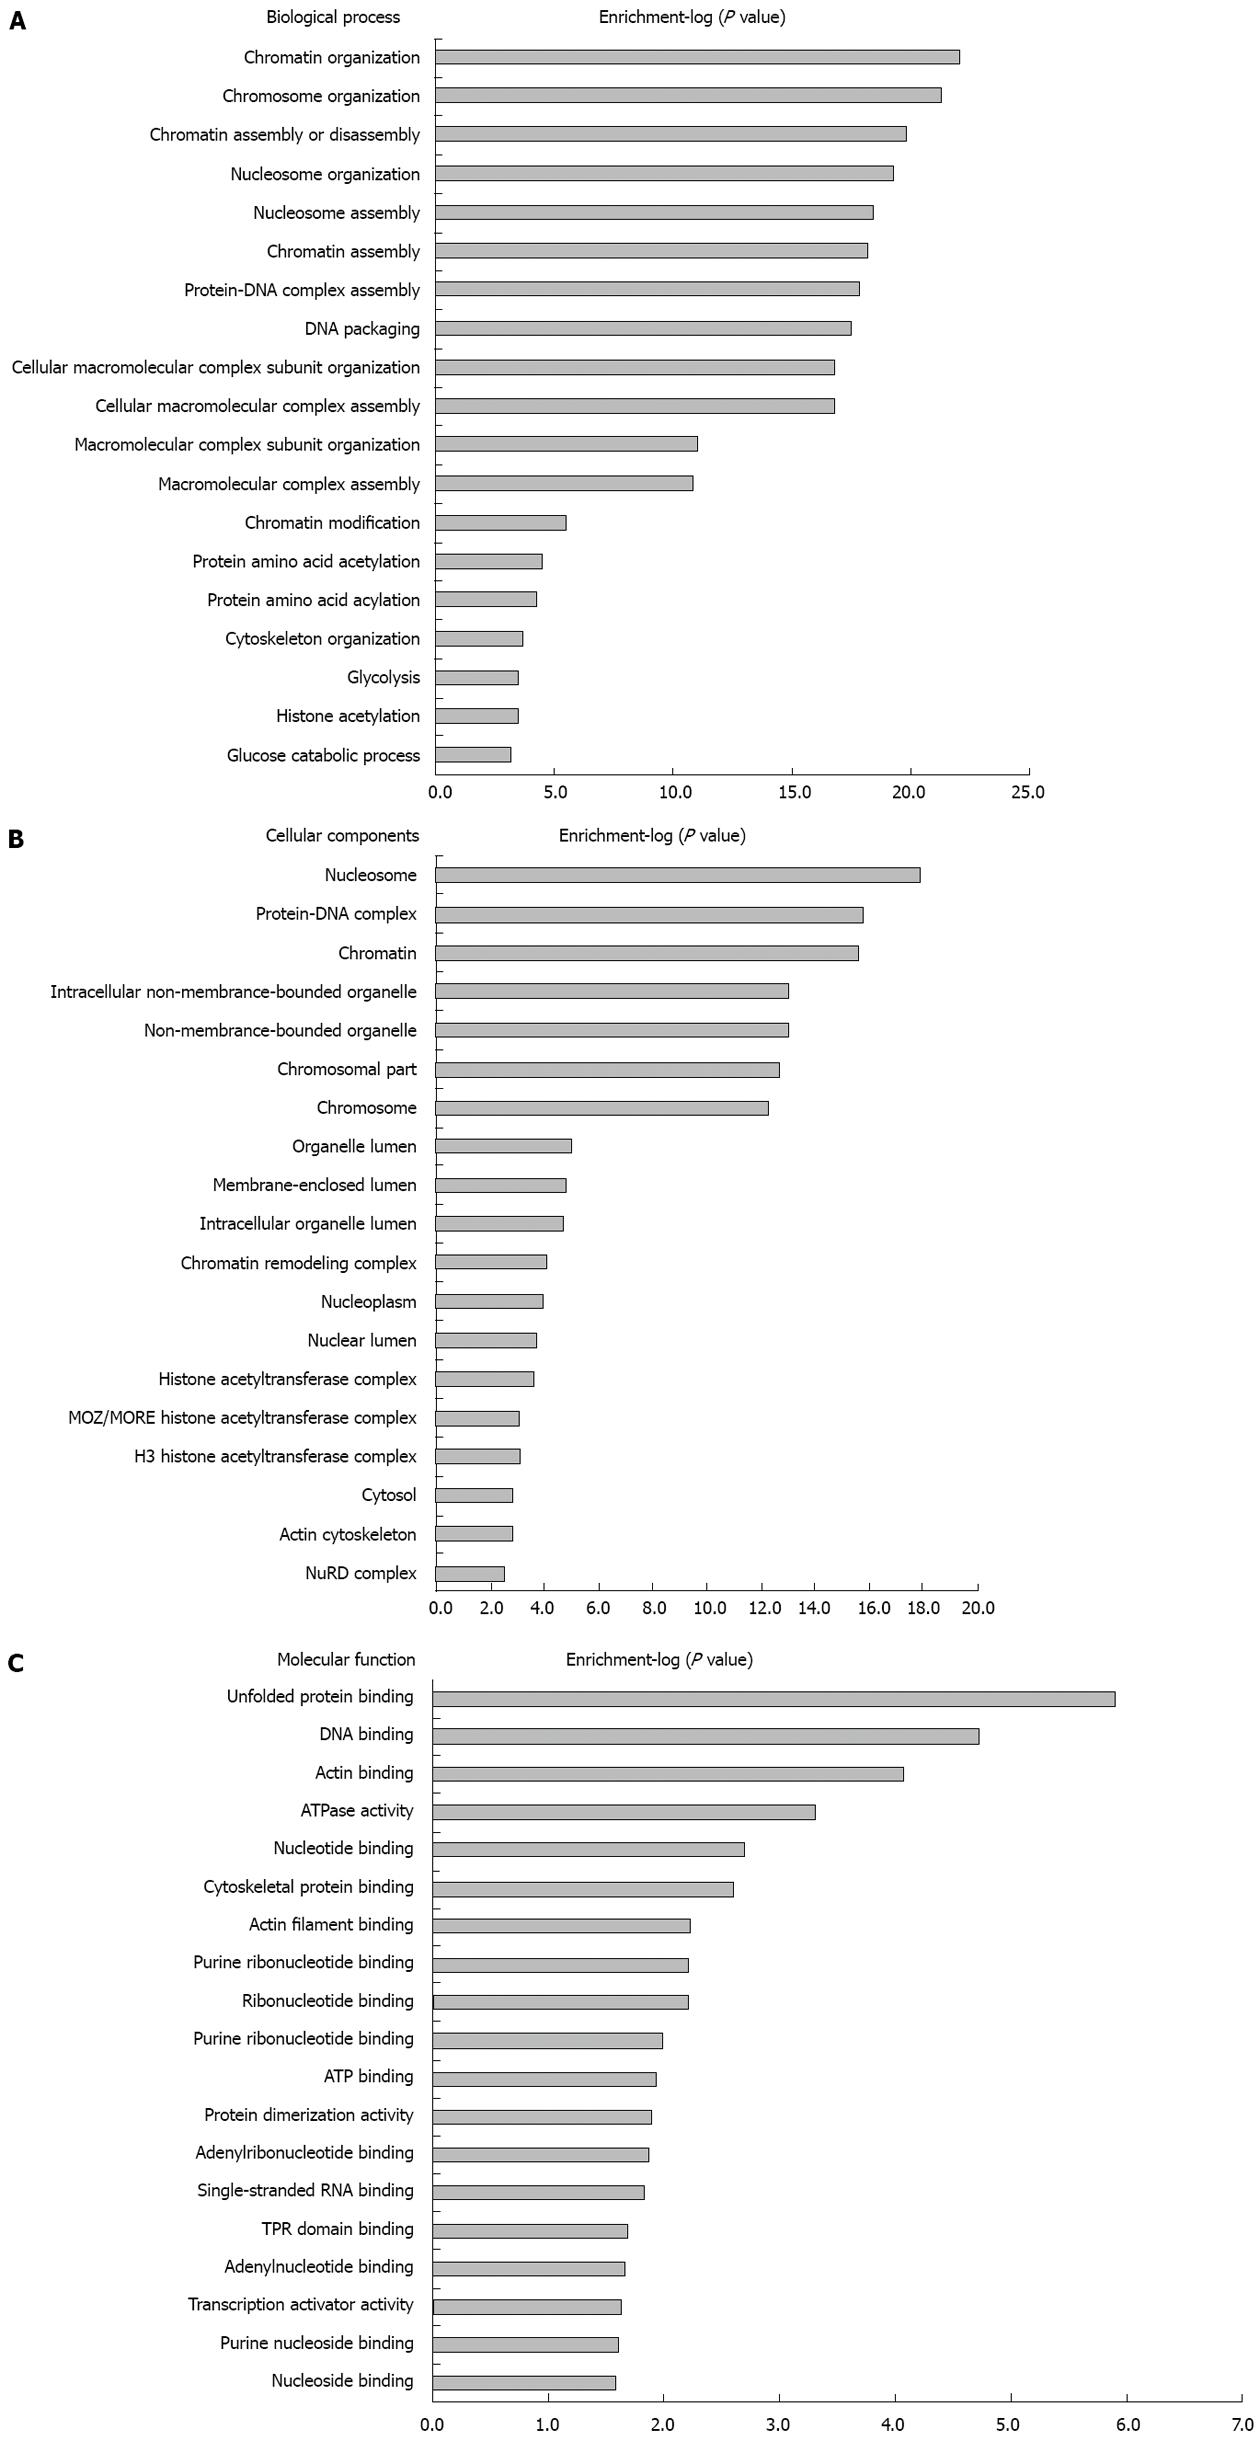
Figure 11 G0 contents based on biological process, cellular components and molecular function in which differently modified proteins were significantly enriched.
A: Biological process; B: Cellular components; C: Molecular function.
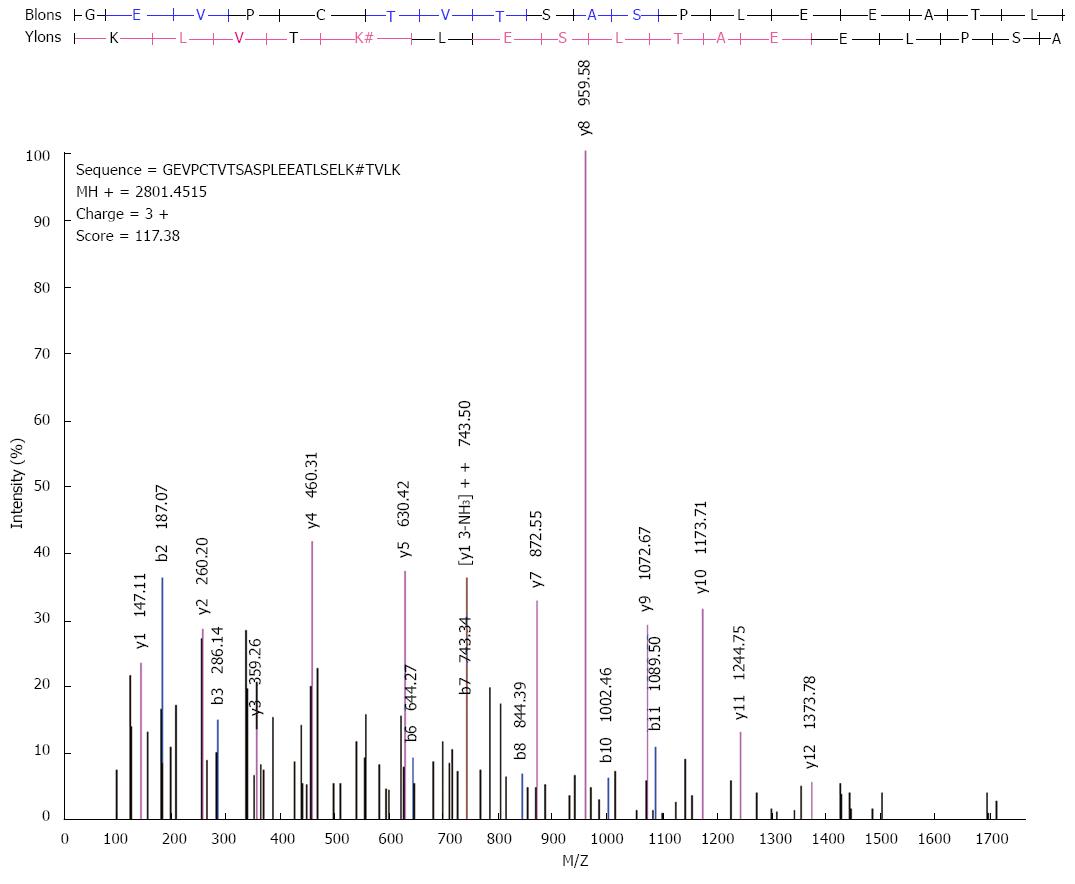
Figure 12 High-resolution MS/MS spectra of acetylated peptide at lysine 158 (GEVPCTVTSASPLEEATLSELK*TVLK) in ATP5O.
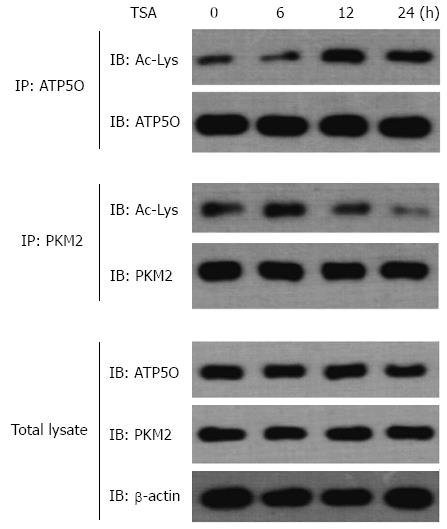
Figure 13 AGS cells were exposed to 0.
5 μmol/L trichostatin A for the indicated time periods and then ATP5O and PKM2 protein were immunoprecipitated using an anti-ATP5O antibody and an anti-PKM2 antibody. Total ATP5O and acetylation of ATP5O were detected using an anti-ATP5O antibody and an antibody specific to acetylated lysine, respectively. Total PKM2 and deacetylation of PKM2 were detected using an anti-PKM2 antibody and an antibody specific to deacetylated lysine, respectively. ATP5O, PKM2 and β-Actin protein levels in the total lysate are also shown.
- Citation: Wang YG, Wang N, Li GM, Fang WL, Wei J, Ma JL, Wang T, Shi M. Mechanisms of trichostatin A inhibiting AGS proliferation and identification of lysine-acetylated proteins. World J Gastroenterol 2013; 19(21): 3226-3240
- URL: https://www.wjgnet.com/1007-9327/full/v19/i21/3226.htm
- DOI: https://dx.doi.org/10.3748/wjg.v19.i21.3226


