Copyright
©2013 Baishideng Publishing Group Co.
World J Gastroenterol. Apr 21, 2013; 19(15): 2404-2411
Published online Apr 21, 2013. doi: 10.3748/wjg.v19.i15.2404
Published online Apr 21, 2013. doi: 10.3748/wjg.v19.i15.2404
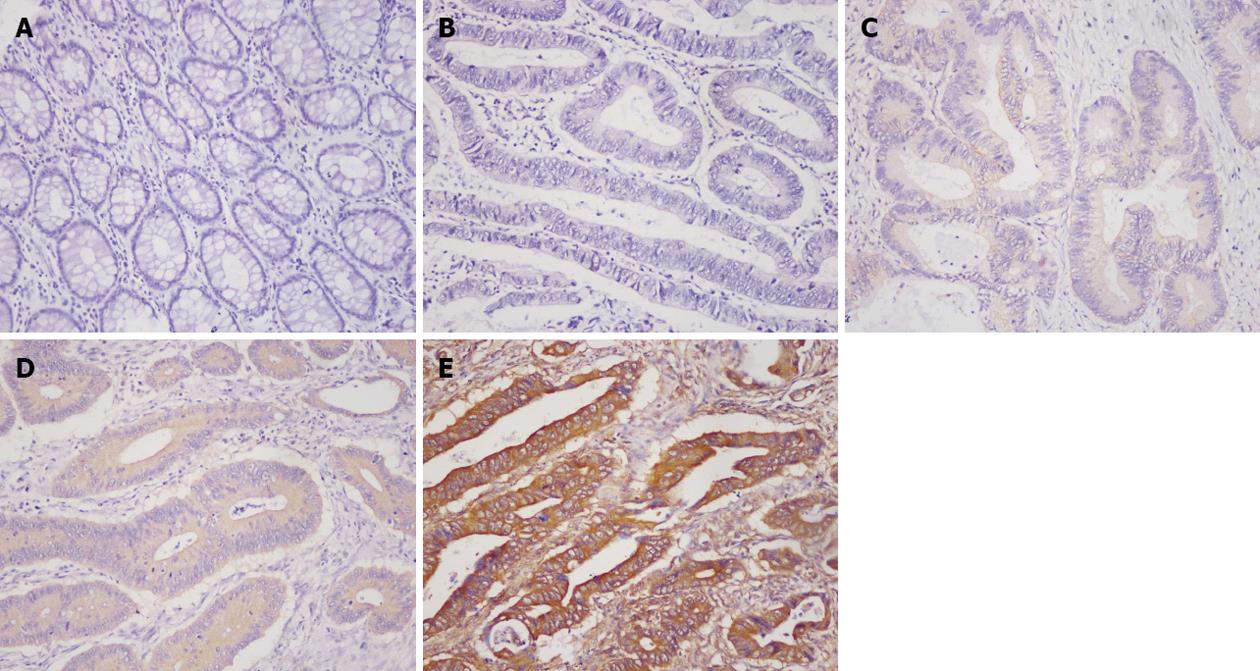
Figure 1 Immunohistochemical images of Twist2.
A: Negative staining in the normal mucosa; B: Negative; C: Weak; D: Moderate; E: Strong cytoplasmic staining in colorectal cancer (200× magnification).
Figure 2 Immunohistochemical images of E-cadherin.
A: Strong and homogeneous staining in normal mucosa; B: Preserved expression in colorectal cancer (CRC); C: Reduced expression in CRC (200× magnification).
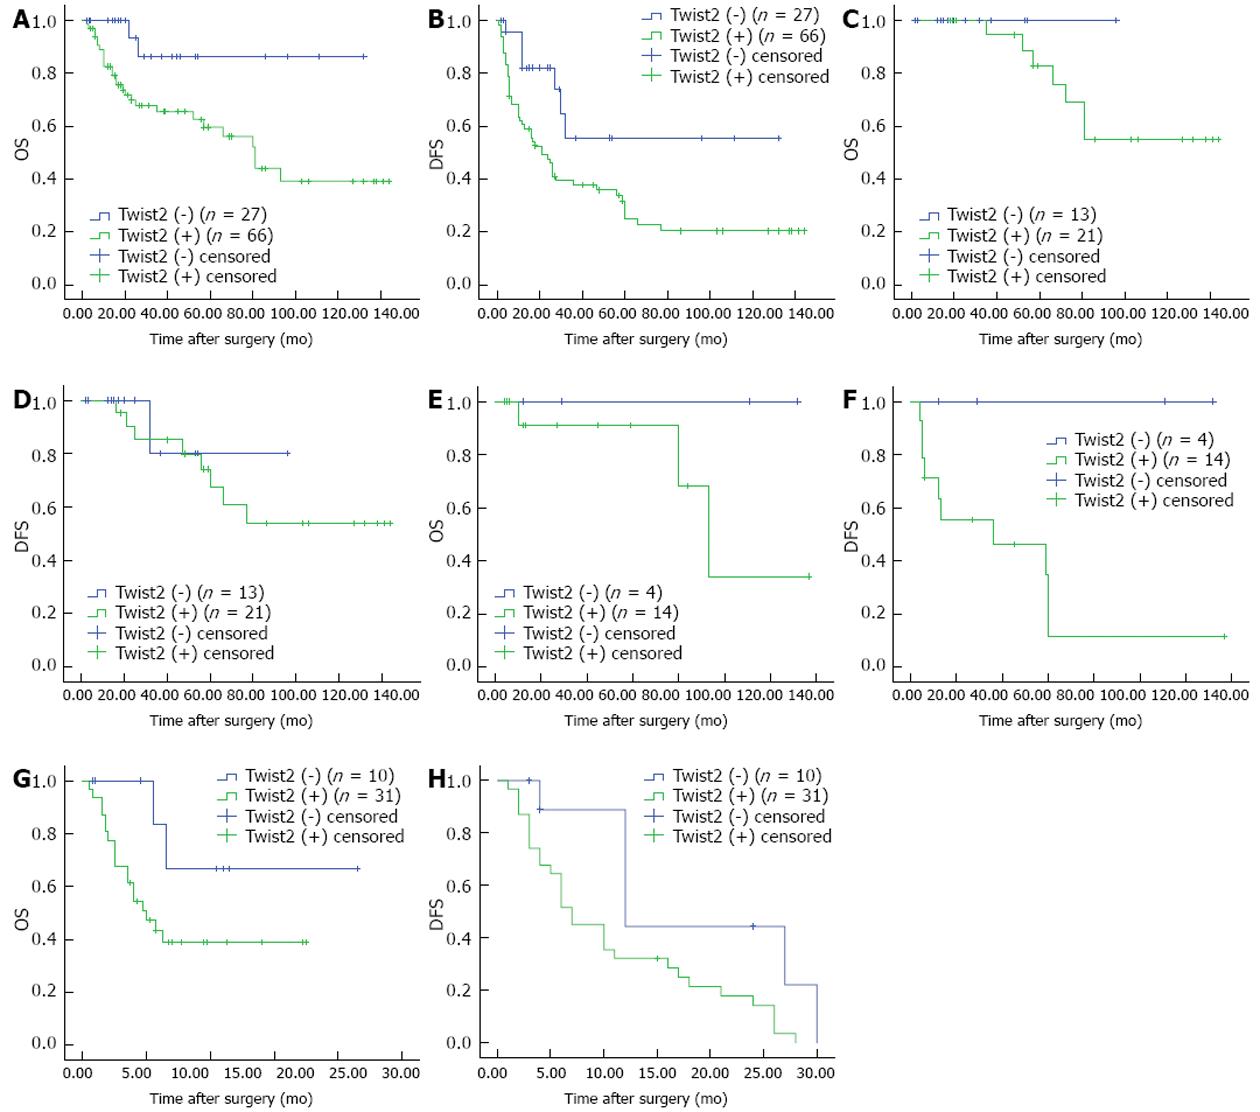
Figure 3 Kaplan-Meier analysis of overall survival and disease-free survival, according to the expression levels of Twist2.
A, B: All patients (A, OS, P = 0.015 and B, DFS, P = 0.012); C, D: Patients in stage I-II (C, OS, P = 0.351 and D, DFS, P = 0.652); E, F: Patients in stage III (E, OS, P = 0.178 and F, DFS, P = 0.033); G, H: Patients in stage IV (G, OS, P = 0.101 and H, DFS, P = 0.026). OS: Overall survival; DFS: Disease-free survival.
- Citation: Yu H, Jin GZ, Liu K, Dong H, Yu H, Duan JC, Li Z, Dong W, Cong WM, Yang JH. Twist2 is a valuable prognostic biomarker for colorectal cancer. World J Gastroenterol 2013; 19(15): 2404-2411
- URL: https://www.wjgnet.com/1007-9327/full/v19/i15/2404.htm
- DOI: https://dx.doi.org/10.3748/wjg.v19.i15.2404


