Copyright
©2012 Baishideng Publishing Group Co.
World J Gastroenterol. Dec 28, 2012; 18(48): 7384-7393
Published online Dec 28, 2012. doi: 10.3748/wjg.v18.i48.7384
Published online Dec 28, 2012. doi: 10.3748/wjg.v18.i48.7384
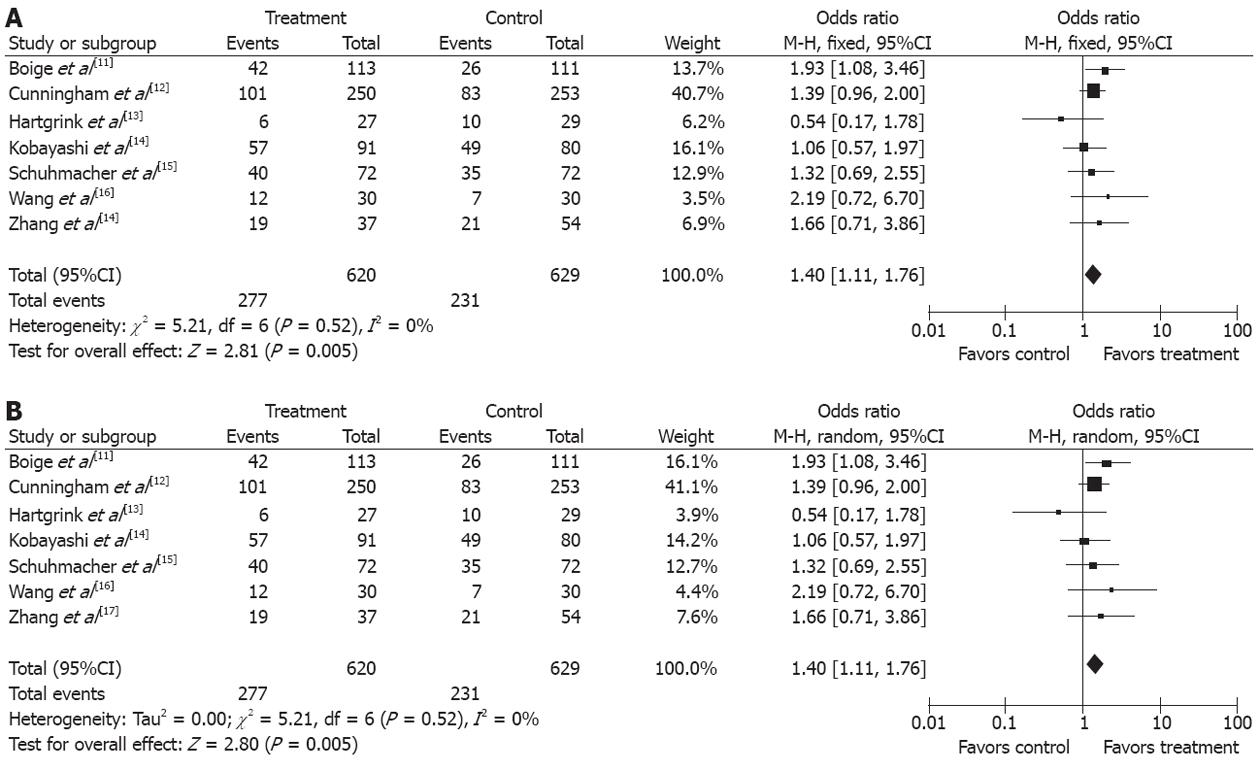
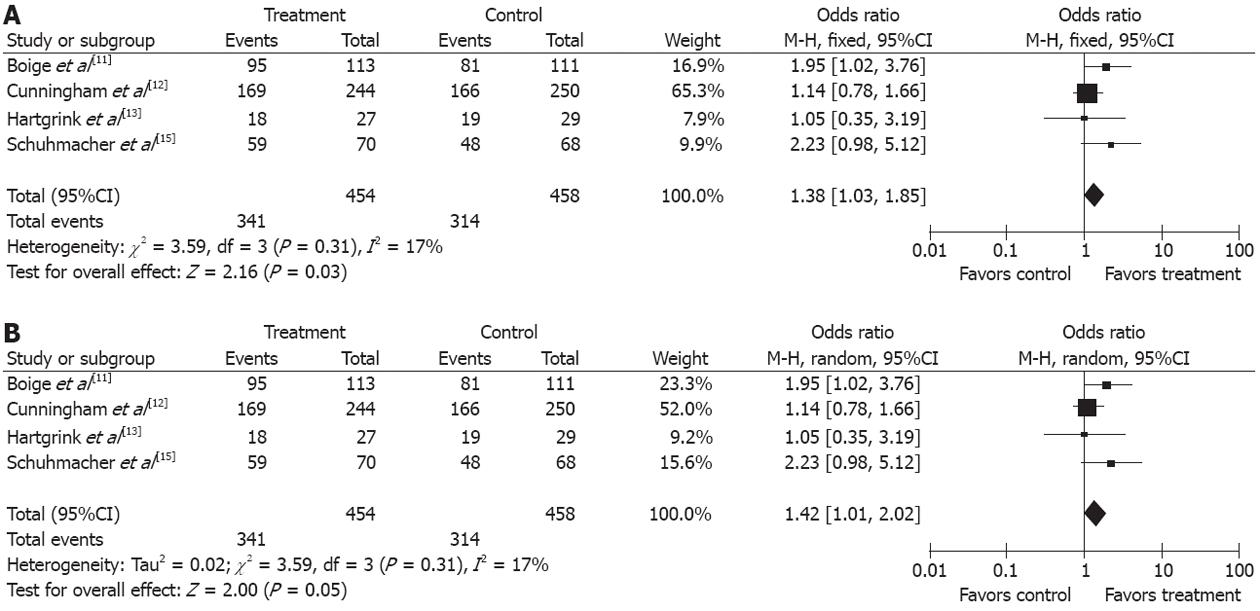
Figure 1 Effect of neoadjuvant chemotherapy on overall survival rate.
A: Overall survival rate (fixed effects model); B Overall survival rate (random effects model).
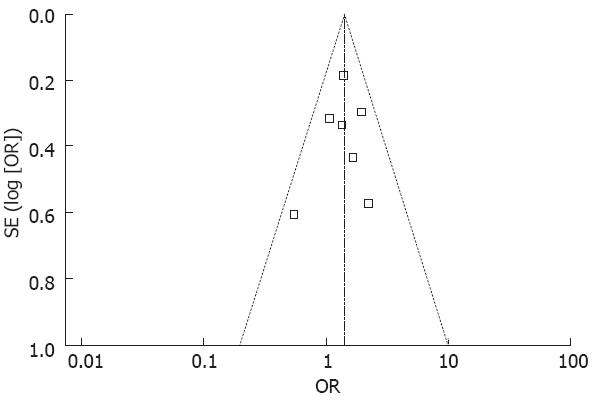
Figure 2 Publication bias in the included studies.
Funnel plot analysis of potential publication bias. OR: Odds ratio.
Figure 3 Effect of neoadjuvant chemotherapy in progression free survival rate.
A: Progression free survival rate (fixed effects model); B Progression free survival rate (random effects model).
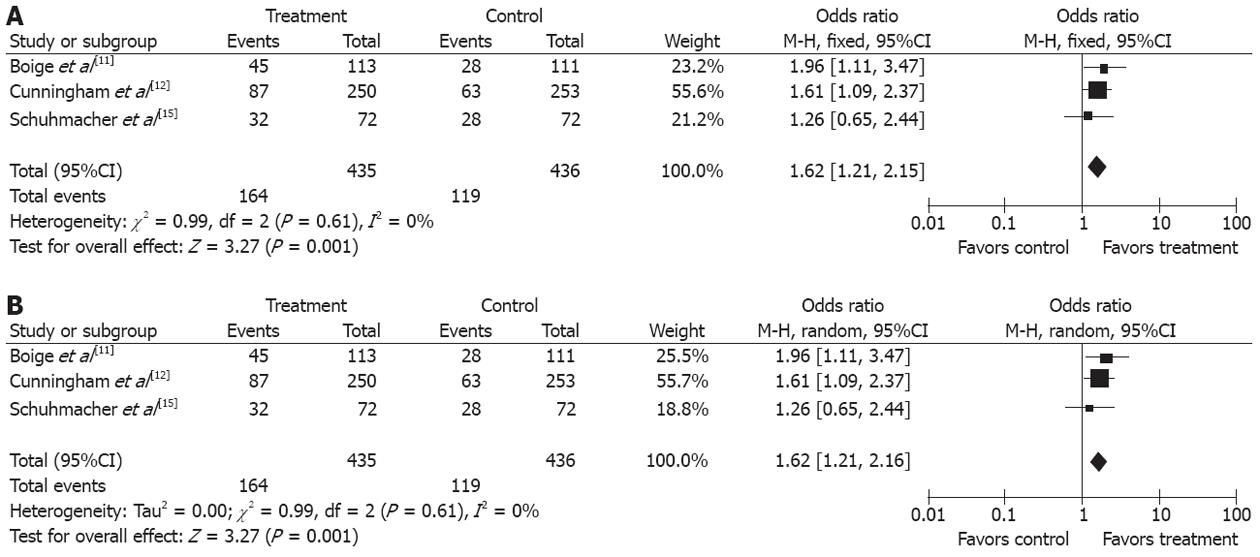
Figure 4 Effect of neoadjuvant chemotherapy in tumor down-staging.
A: Tumor down-staging rate (fixed effects model); B Tumor down-staging rate (random effects model).
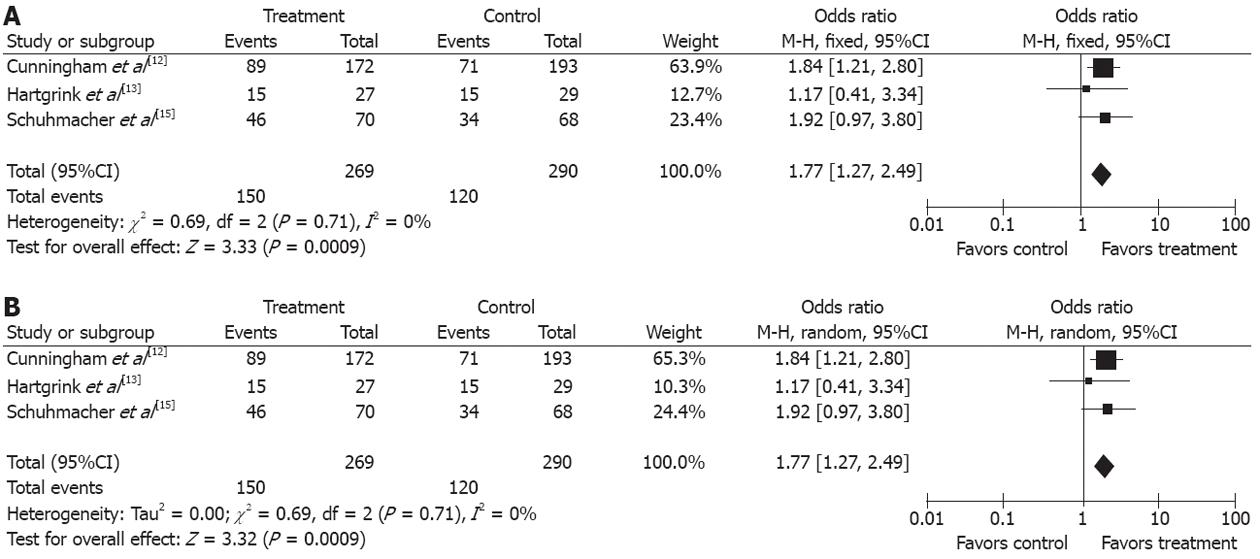
Figure 5 Effect of neoadjuvant chemotherapy in tumor R-0 resection.
A: R-0 resection rate (fixed effects model); B: R-0 resection rate (random effects model).
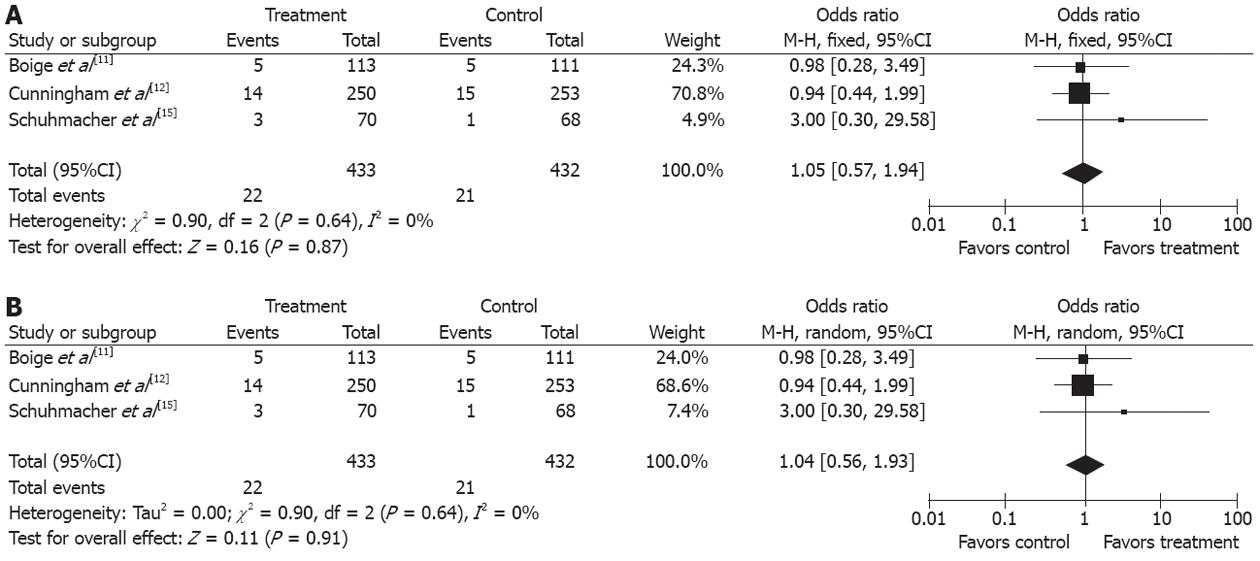
Figure 6 Effect of neoadjuvant chemotherapy in perioperative mortality.
A: Perioperative mortality rate (fixed effects model); B: Perioperative mortality rate (random effects model).
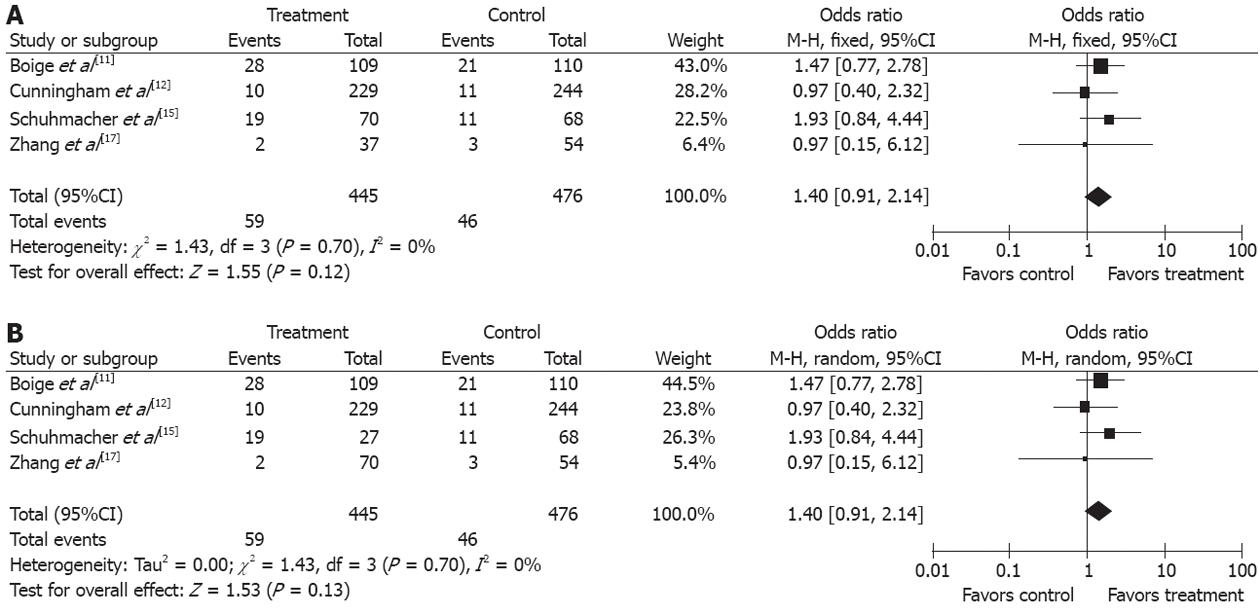
Figure 7 Effect of neoadjuvant chemotherapy in postoperative complications.
A: Postoperative complications rate (fixed effects model); B: Postoperative complications rate (random effects model).
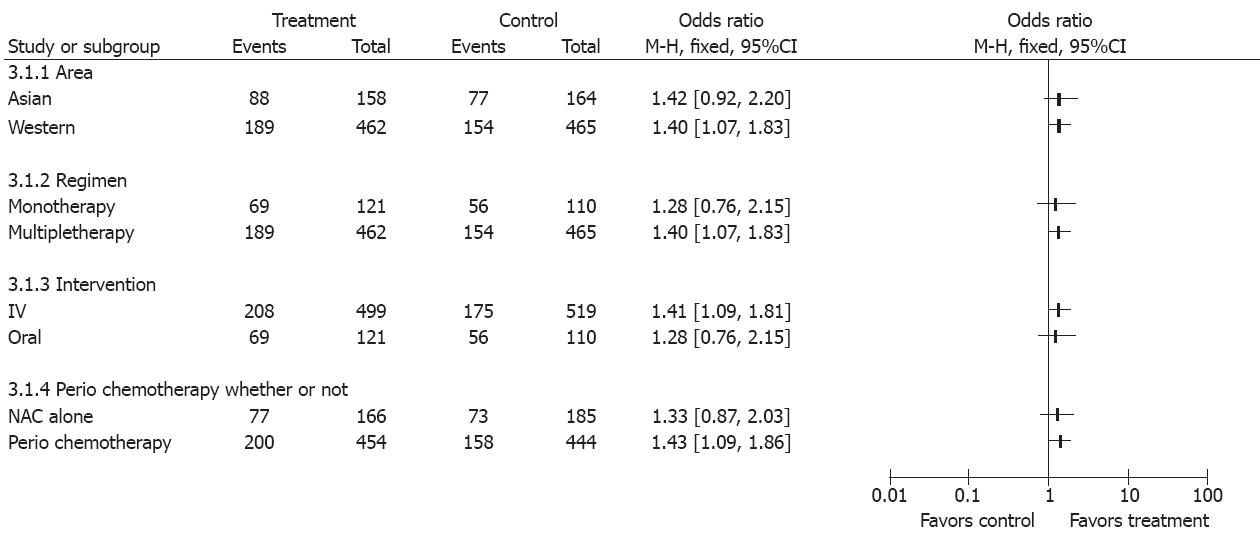
Figure 8 Subgroup analysis showing different overall survival rates in patients with advanced gastric cancer.
- Citation: Ge L, Wang HJ, Yin D, Lei C, Zhu JF, Cai XH, Zhang GQ. Effectiveness of 5-flurouracil-based neoadjuvant chemotherapy in locally-advanced gastric/gastroesophageal cancer: A meta-analysis. World J Gastroenterol 2012; 18(48): 7384-7393
- URL: https://www.wjgnet.com/1007-9327/full/v18/i48/7384.htm
- DOI: https://dx.doi.org/10.3748/wjg.v18.i48.7384


