Copyright
©2012 Baishideng Publishing Group Co.
World J Gastroenterol. Dec 28, 2012; 18(48): 7362-7370
Published online Dec 28, 2012. doi: 10.3748/wjg.v18.i48.7362
Published online Dec 28, 2012. doi: 10.3748/wjg.v18.i48.7362
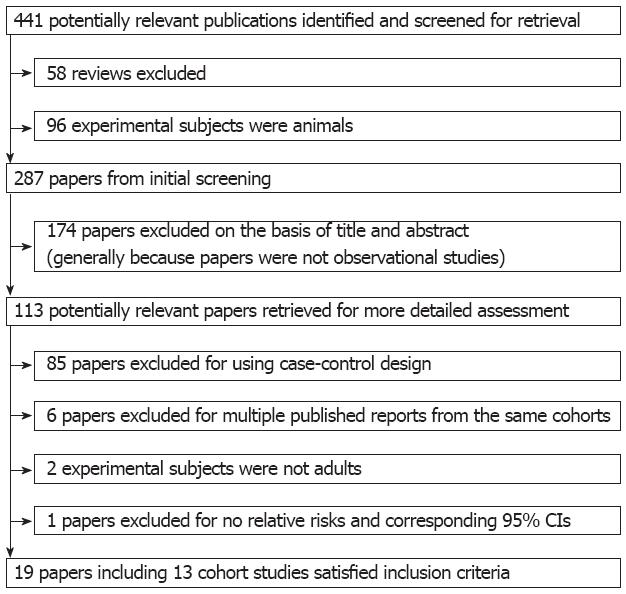
Figure 1 Flow diagram of the search strategy and study selection.
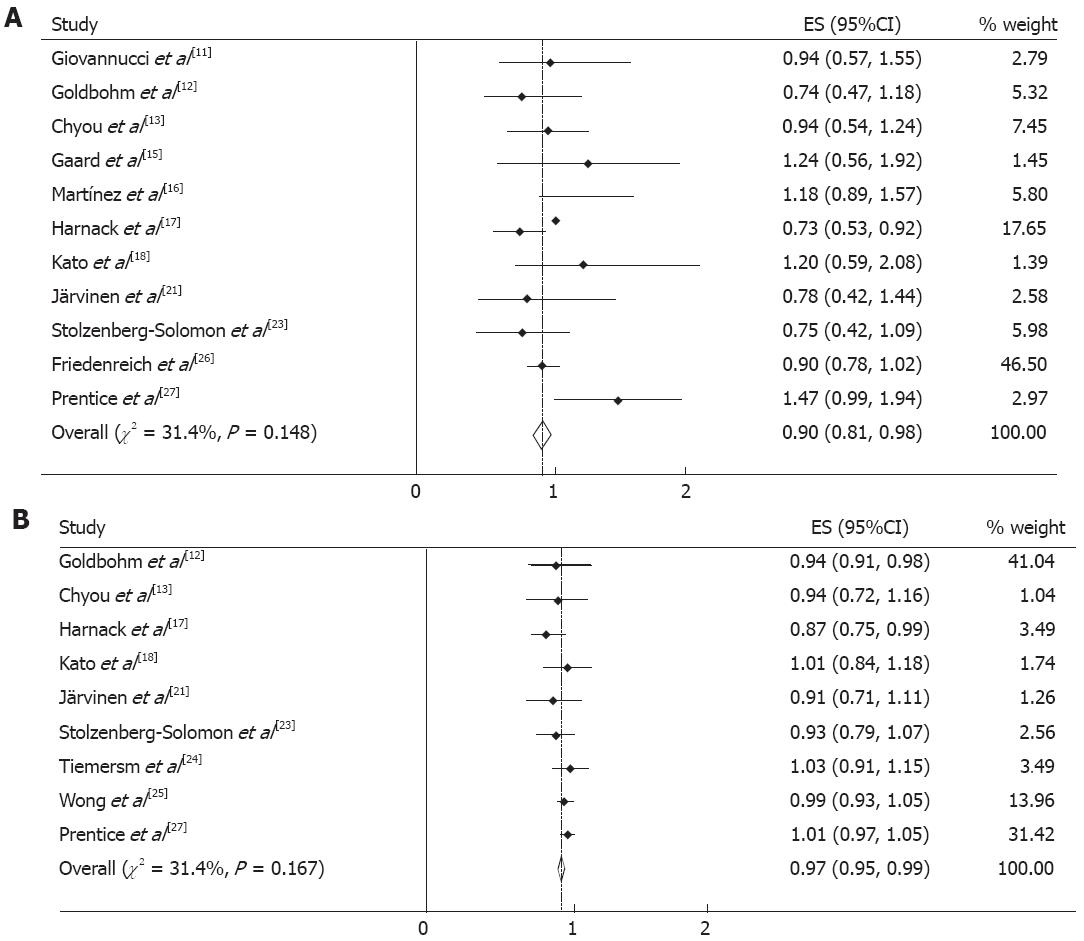
Figure 2 Summary relative risks of digestive cancers.
A: The highest vs lowest category of energy intake from included cohorts; B: An increment of 1 MJ/day energy intake from included cohorts. Squares represent study-specific relative risk (RR) estimates (size of the square reflects the study-specific statistical weight, that is, the inverse of the variance); horizontal lines represent 95%CIs; diamonds represent summary RR estimates with corresponding 95%CIs.
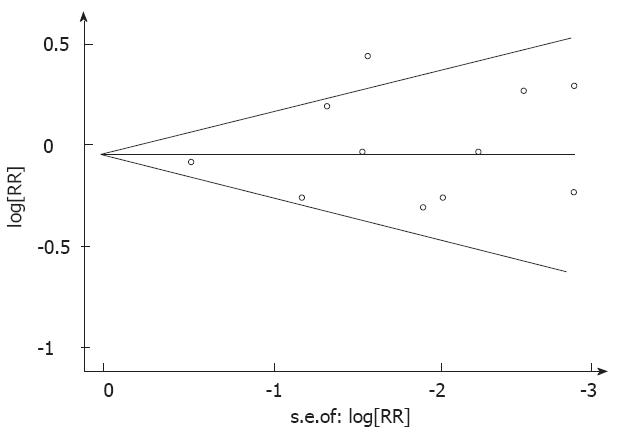
Figure 3 Publication bias in the studies.
Begg’s funnel plot indicating no publication bias in the studies included in this meta-analysis. No indication of publication bias was noted from both visualization of the funnel plot and Egger’s test.
- Citation: Yu XF, Wang YQ, Zou J, Dong J. A meta-analysis of the effects of energy intake on risk of digestive cancers. World J Gastroenterol 2012; 18(48): 7362-7370
- URL: https://www.wjgnet.com/1007-9327/full/v18/i48/7362.htm
- DOI: https://dx.doi.org/10.3748/wjg.v18.i48.7362


