Copyright
©2012 Baishideng Publishing Group Co.
World J Gastroenterol. Dec 28, 2012; 18(48): 7212-7224
Published online Dec 28, 2012. doi: 10.3748/wjg.v18.i48.7212
Published online Dec 28, 2012. doi: 10.3748/wjg.v18.i48.7212
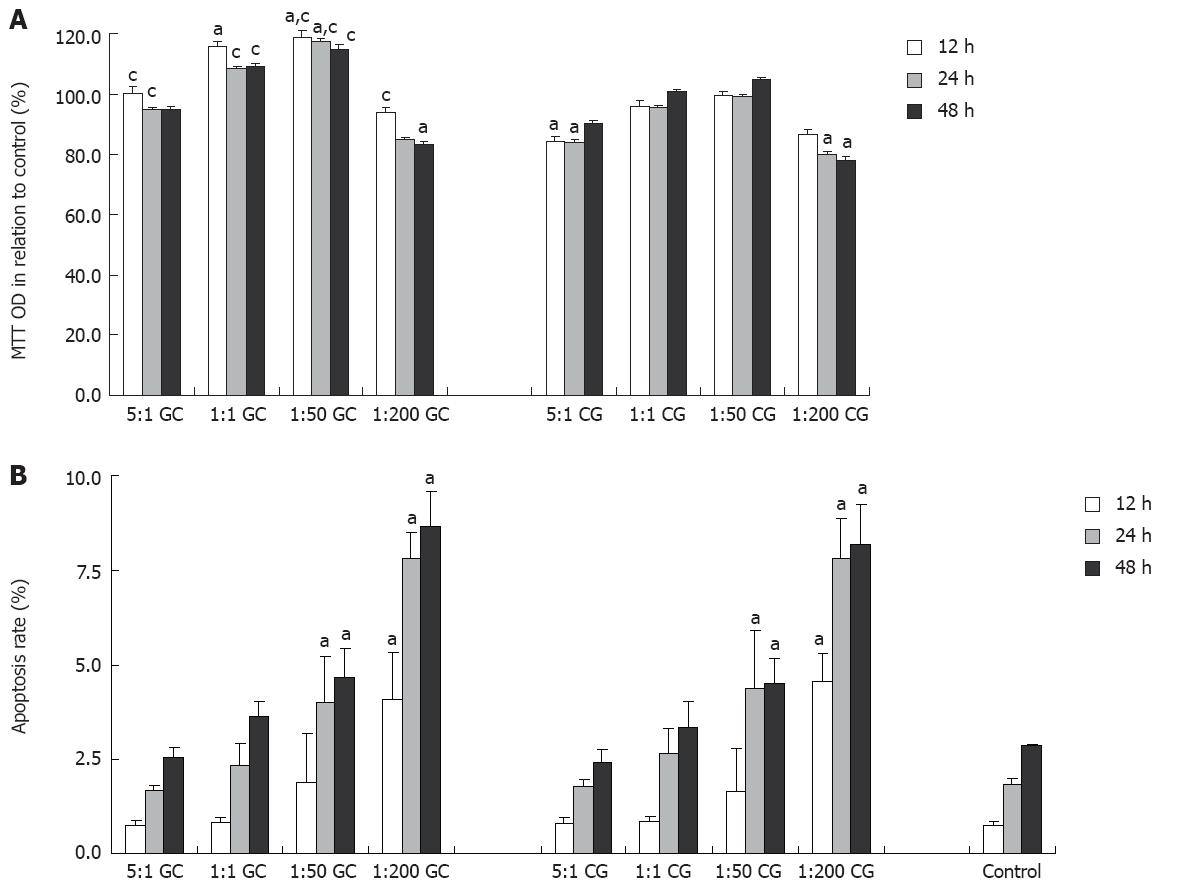
Figure 1 GES-1 cell proliferation as determined by 3-(4,5-dimethylthiazol-2)-2,5-diphenyltetrazolium bromide assay (A) and cell apoptosis as determined by flow cytometry (B) after co-culture with helicobacter pylori isolated from patients with gastric carcinoma (GC, n = 10) or chronic gastritis (CG, n = 10) for 48 h in relation to control cells.
The ratio denotes the ratio of GES-1 cells vs Helicobacter pylori cells. aP < 0.05 vs control group; cP < 0.05 vs CG group. OD: Optical density.
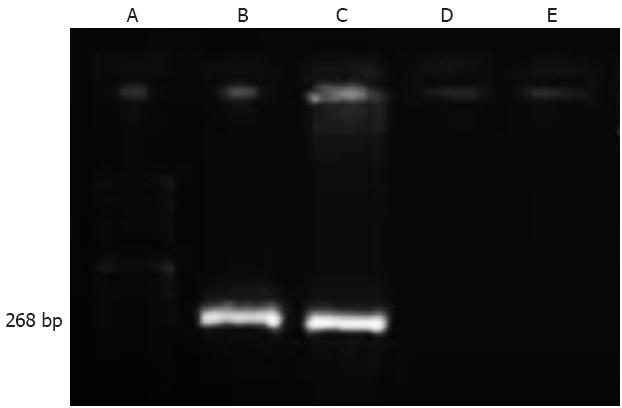
Figure 2 Identification of status of cagA gene in Helicobacter pylori strains using real-time polymerase chain reaction.
A: DNA ladder; B: Helicobacter pylori (H. pylori) stain NCTC 11639 (positive control); C: The most virulent gastric carcinoma-derived strain; D: The least virulent chronic gastritis-derived strain; E: H. pylori stain NCTC 12908 (negative control).
Figure 3 Representative histological microphotographs (hematoxylin and eosin staining, 200 ×, scale bar = 100 μm) of gastric mucosal specimens collected from Mongolian gerbils lavaged with the GC-derived Helicobacter pylori strain (A: gastric carcinoma), the CG-derived strain (B: chronic gastritis), and the control lixivium (C) at the 28th week.
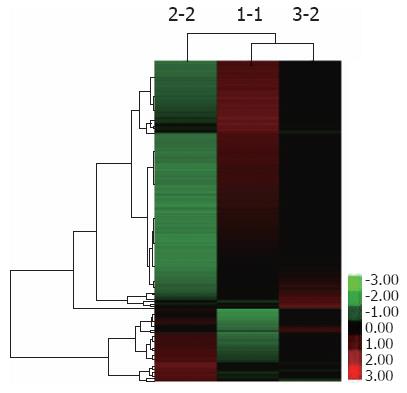
Figure 4 Cluster analysis of gene expression profiles in GES-1 cells in response to the most and least virulent Helicobacter pylori strains.
The red, green, and black colors indicate up-regulated, down-regulated, and equivalent expression. 1-1: Uninfected GES-1 cells (control); 2-2: GES-1 cells co-cultured with the GC-derived strain; 3-2: GES-1 cells co-cultured with the CG-derived strain. GC: Gastric carcinoma; CG: Chronic gastritis.
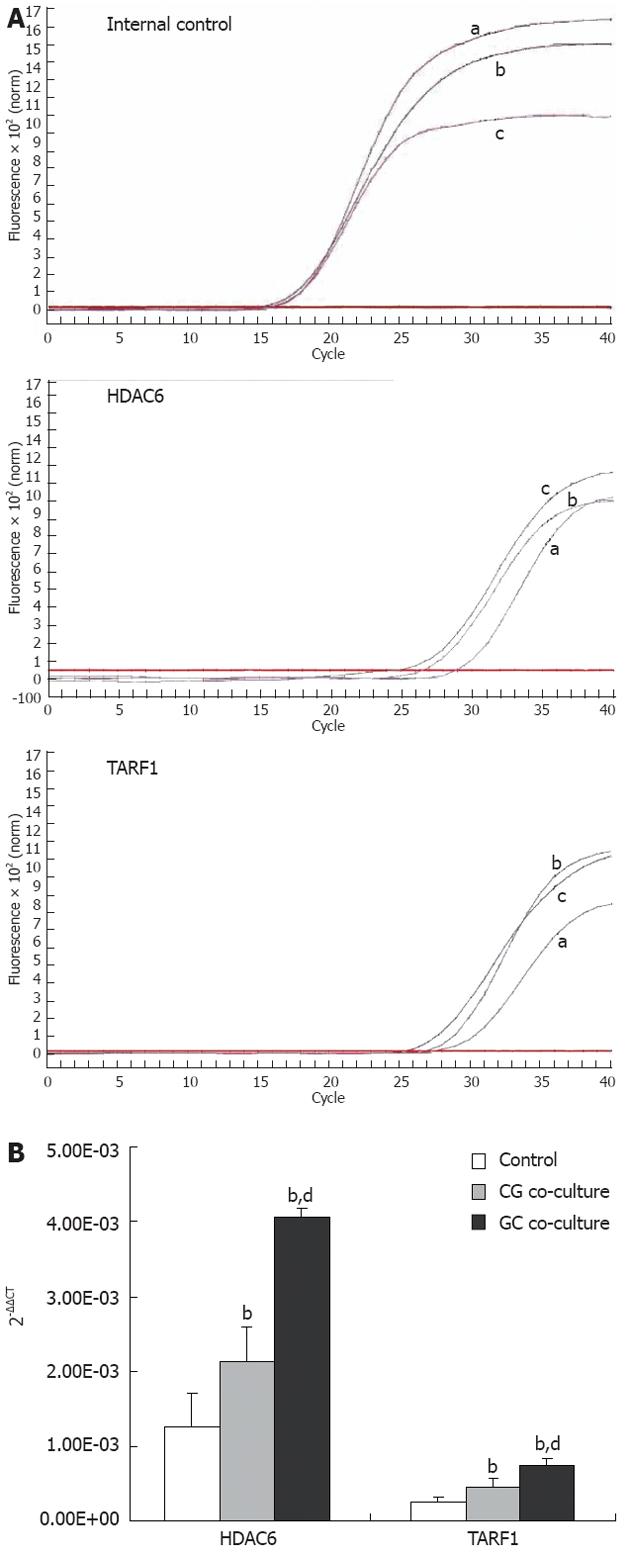
Figure 5 Verification of HDAC6 and TRAF1 up-regulation in GES-1 cells in response to the most and least virulent Helicobacter pylori strains as determined by quantitative real-time polymerase chain reaction analysis.
A: Representative quantitation of mRNA expression of GAPDH, HDAC6 and TRAF1 in GES-1 cells (a), GES-1 cells co-cultured with the CG-derived Helicobacter pylori (H. pylori) strain (b) and GES-1 cells co-cultured with the GC-derived H. pylori strain (c); B: Graphic analysis showing mRNA expression of HDAC6 and TRAF1 expressions in GES-1 cells in GES-1 cells, GES-1 cells co-cultured with the CG-derived H. pylori strain and GES-1 cells co-cultured with the GC-derived H. pylori strain. bP < 0.01 vs the control; dP < 0.01 vs cells co-cultured with the CG-derived H. pylori strain.
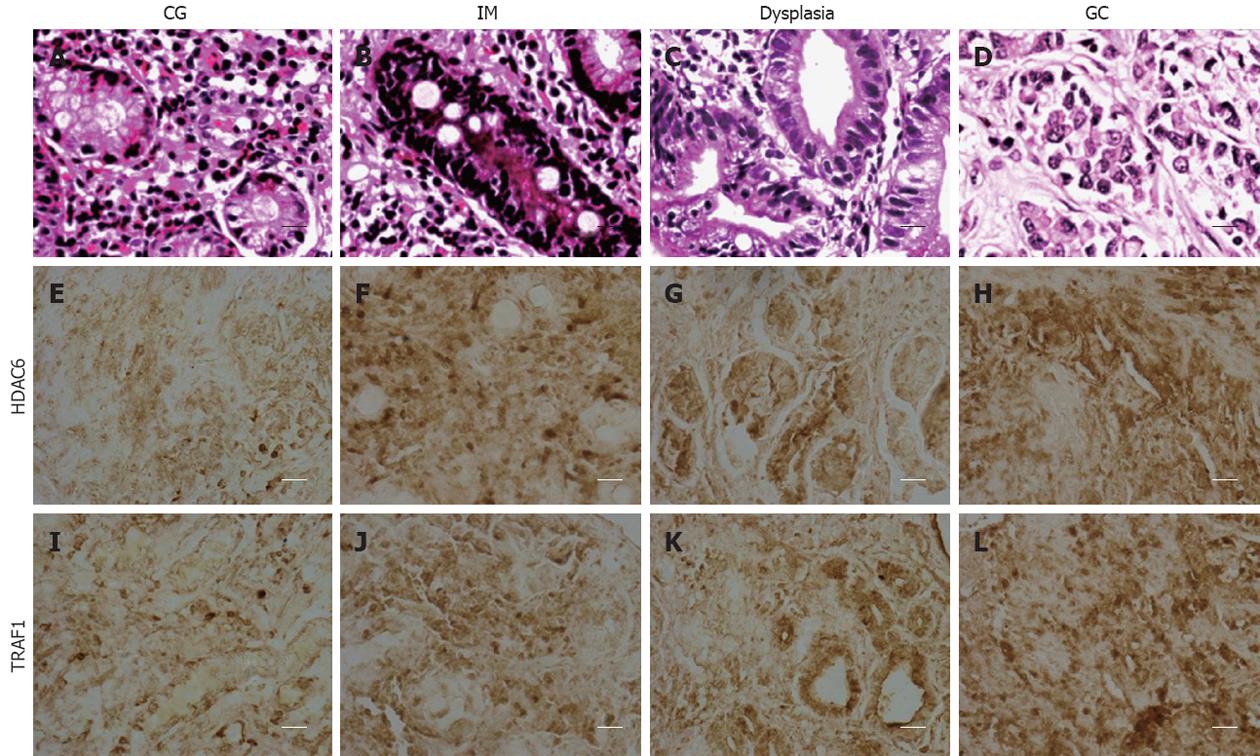
Figure 6 Histology and immunohistochemistry (400 ×, scale bar = 50 μm) of HDAC6 and TRAF1 in gastric specimens of patients with chronic gastritis (CG, n = 23), intestinal metaplasia (IM, n = 30), dysplasia (n = 33), and gastric carcinoma (GC, n = 27).
-
Citation: Wang F, Luo LD, Pan JH, Huang LH, Lv HW, Guo Q, Xu CX, Shen SR. Comparative genomic study of gastric epithelial cells co-cultured with
Helicobacter pylori . World J Gastroenterol 2012; 18(48): 7212-7224 - URL: https://www.wjgnet.com/1007-9327/full/v18/i48/7212.htm
- DOI: https://dx.doi.org/10.3748/wjg.v18.i48.7212


