Copyright
©2012 Baishideng Publishing Group Co.
World J Gastroenterol. Dec 21, 2012; 18(47): 7070-7078
Published online Dec 21, 2012. doi: 10.3748/wjg.v18.i47.7070
Published online Dec 21, 2012. doi: 10.3748/wjg.v18.i47.7070
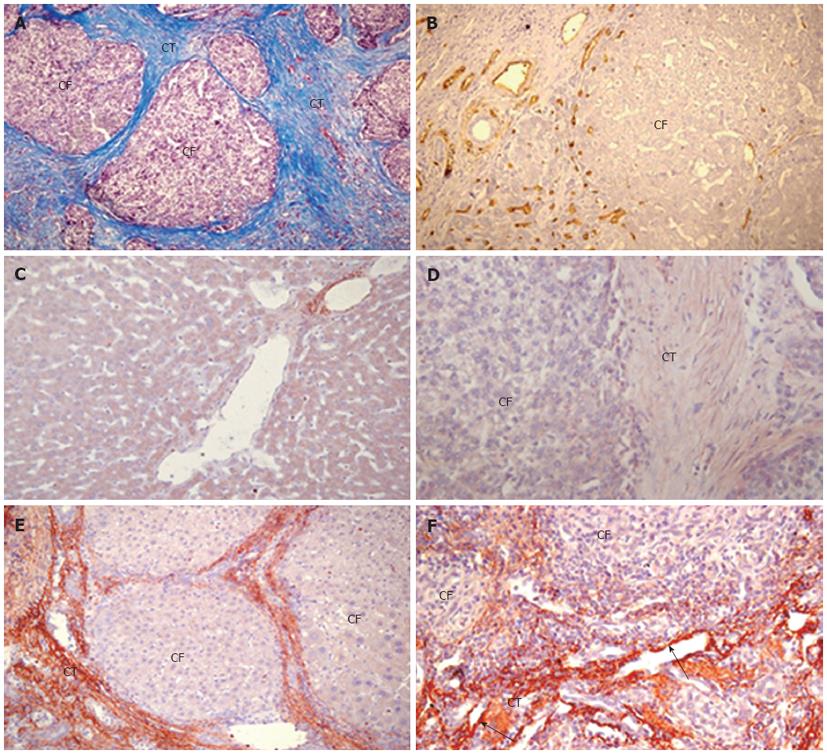
Figure 1 Expression and distribution characteristics of transforming growth factor β1 or connective tissue growth factor mRNA in human hepatocellular carcinoma.
A: Masson’s trichrome stain for collagen (blue) in hepatocellular carcinoma (HCC); B: Immunohistochemical detection of CD34 in vascular endothelial cells (brown) in HCC; C: Normal liver showing connective tissue growth factor (CCN2) mRNA expressed in connective tissue around the veins; D: Absence of staining of HCC when the in situ hybridization probes were omitted; E: HCC stained for transforming growth factor β1 mRNA, showing reactivity in connective tissue and around the carcinoma foci; F: Over-expression of CCN2 mRNA in connective tissue and vascular endothelial cells (black arrow) in HCC. Original magnification, × 100 in A and E, × 200 in B, C, D and F. CF: Carcinoma foci; CT: Connective tissue.
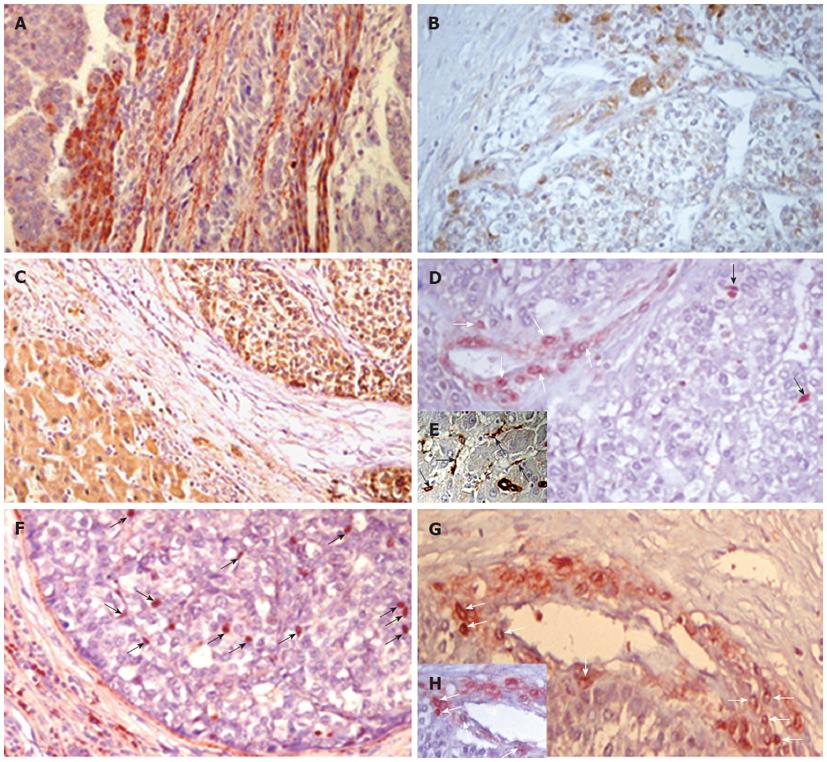
Figure 2 Expression of connective tissue growth factor mRNA and its association with epithelial-mesenchymal transition in hepatocellular carcinoma.
Connective tissue growth factor (CCN2) mRNA (A) or protein (B) were detected in hepatoma cells at the edge of carcinoma foci by in situ hybridization or immunohistochemistry respectively; C: E-cadherin was only weakly detectable in carcinoma foci but stained more intensely in normal hepatocytes; D, E: Fibroblast-specific protein-1 (FSP-1)-positive hepatoma cells (white arrow) were located at a position between the edge of carcinoma foci and vascular wall; FSP-1-positive (black arrows) (D) or (E) α-smooth muscle actin-positive (black arrows) fibroblast-like or myofibroblast-like hepatic stellate cell (HSC) were found within carcinoma foci; F-H: CCN2 mRNA was detected in either fibroblast-like or myofibroblast-like HSC (black arrows); CCN2 mRNA (G) or (H) FSP-1 were found in some hepatoma cells. Original magnification, × 400 in A, B, C, D, F and G, × 200 in E and H. Examples of positively stained cells or structures in each panel are arrowed.
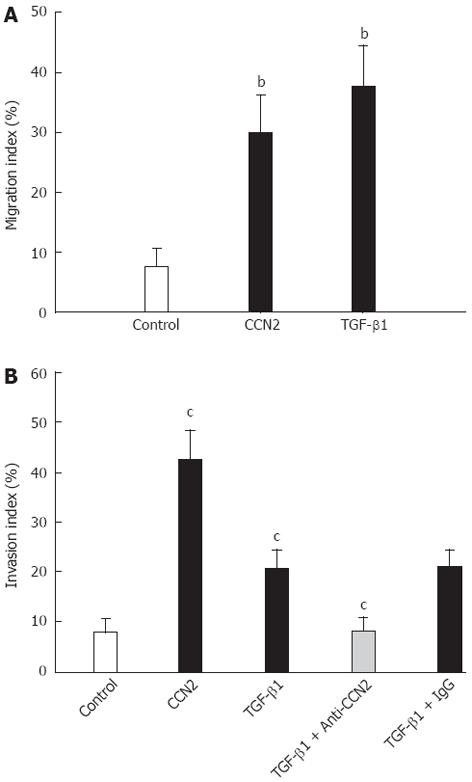
Figure 3 Connective tissue growth factor induces HepG2 cell migration or invasion in vitro.
A: HepG2 cell migration assays were performed by placing the cells in culture inserts followed by incubation in a 12-well companion plate for 6 h in the absence (control) or presence of connective tissue growth factor (100 ng/mL) or transforming growth factor β1 (TGF-β1) (20 ng/mL) in the lower chamber; B: HepG2 cell invasion assays were performed by placing the cells in culture inserts followed by incubation in a 24-well companion plate for 24 h in the absence (control) or presence of connective tissue growth factor (100 ng/mL) or TGF-β1 (20 ng/mL) in the lower chamber. For inhibitory studies, HepG2 cells were incubated with 25 μg/mL anti-connective tissue growth factor (CCN2), or normal mouse immunoglobulin G during treatment with TGF-β1. bP < 0.01 vs control or CCN2 group; cP < 0.05 vs TGF-β1 group.
- Citation: Xiu M, Liu YH, Brigstock DR, He FH, Zhang RJ, Gao RP. Connective tissue growth factor is overexpressed in human hepatocellular carcinoma and promotes cell invasion and growth. World J Gastroenterol 2012; 18(47): 7070-7078
- URL: https://www.wjgnet.com/1007-9327/full/v18/i47/7070.htm
- DOI: https://dx.doi.org/10.3748/wjg.v18.i47.7070


