Copyright
©2012 Baishideng Publishing Group Co.
World J Gastroenterol. Dec 21, 2012; 18(47): 7040-7047
Published online Dec 21, 2012. doi: 10.3748/wjg.v18.i47.7040
Published online Dec 21, 2012. doi: 10.3748/wjg.v18.i47.7040
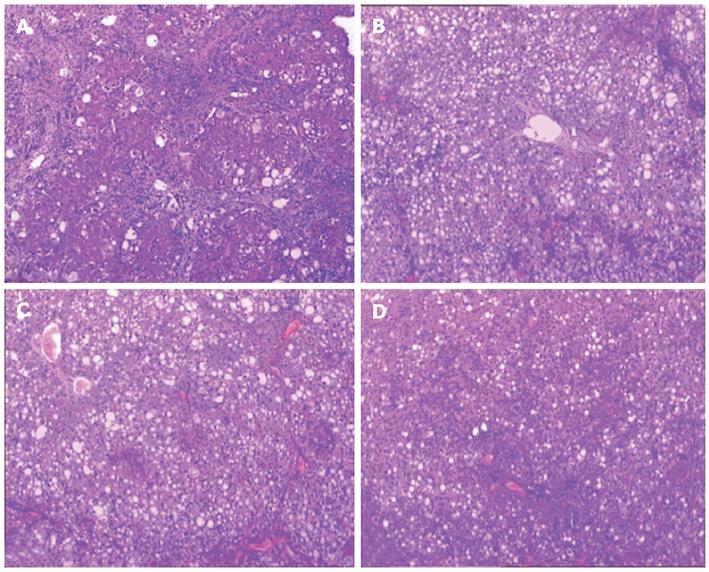
Figure 1 Liver histopathology in cirrhotic rats.
A: Untreated group; B: Low-dose salvianolate-treated group; C: Medium-dose salvianolate-treated group; D: High-dose salvianolate-treated group (hematoxylin and eosin staining, × 200).
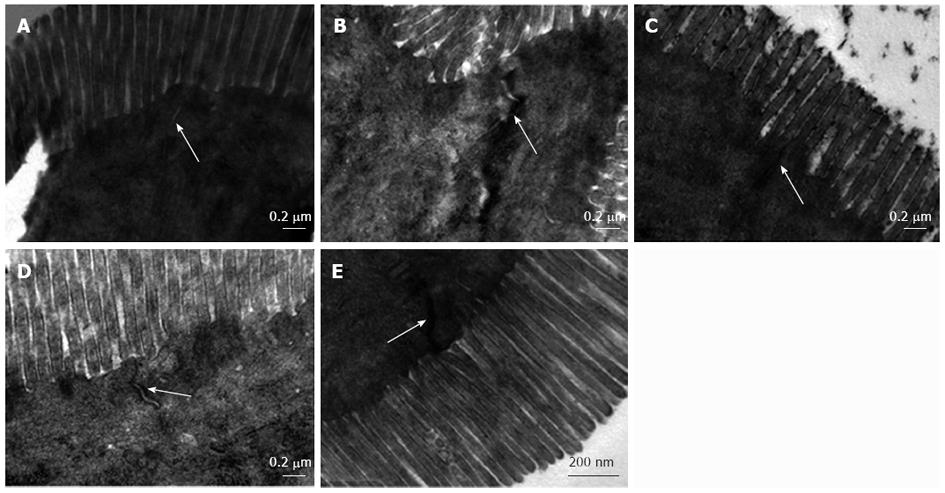
Figure 2 Tight junction structural morphology in ileal mucosa.
A: Normal control group; B: Untreated group; C: Low-dose salvianolate-treated group; D: Medium-dose salvianolate-treated group; E: High-dose salvianolate-treated group (transmission electron microscopy, × 26 500).
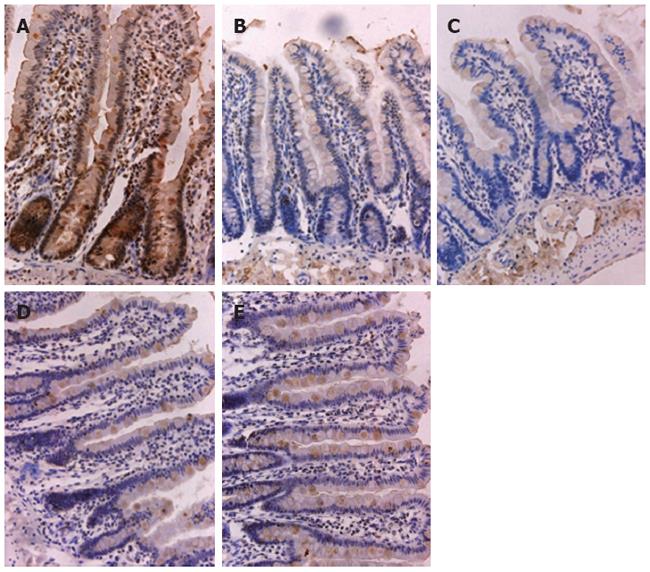
Figure 3 Immunohistochemical staining for zonula occludens protein 1 in ileal mucosa.
A: Normal control group; B: Untreated group; C: Low-dose salvianolate-treated group; D: Medium-dose salvianolate-treated group; E: High-dose salvianolate-treated group (× 40).
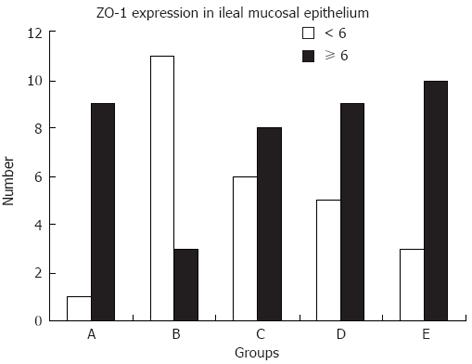
Figure 4 Expression of zonula occludens protein 1 in ileal mucosa.
A: Normal control group; B: Untreated group; C: Low-dose salvianolate-treated group; D: Medium-dose salvianolate-treated group; E: High-dose salvianolate-treated group. The staining index was calculated as the product of the staining intensity score and the proportion of positive cells. We evaluated zonula occludens protein 1 (ZO-1) expression in the five groups by determining the staining index with scores of 0, 1, 2, 3, 4, 6, or 9. An optimal cutoff value was identified as follows: a staining index score of ≥ 6 was used to define high ZO-1 expression and a staining index score of < 3 was used to indicate low ZO-1 expression.
- Citation: Yang DH, Ye ZY, Xie YJ, He XJ, Xu WJ, Zhou WM. Effect of salvianolate on intestinal epithelium tight junction protein zonula occludens protein 1 in cirrhotic rats. World J Gastroenterol 2012; 18(47): 7040-7047
- URL: https://www.wjgnet.com/1007-9327/full/v18/i47/7040.htm
- DOI: https://dx.doi.org/10.3748/wjg.v18.i47.7040


